Weekly Market Outlook - Each Step Forward is Getting Tougher to Take
Another week, another win, quickly quelling the weakness that started to take shape the week before. The S&P 500 only gained 0.73% for the five-day stretch, and was strained to make that move. The boost driven by encouraging trade news was modest, at best. Still, traders look like they're intent on driving the usual Santa Claus rally that takes shape this time of year.
We'll take a closer look at the whole thing below, as always. First though, let's paint with the broad brush strokes of economic data. Traders are still ultimately taking their cues from these numbers, trying to figure out if a recession looms or if everything's fine.
Economic Data Analysis
The week wasn't too busy in terms of economic announcements, but several of the ones we got were heavy hitters. It was an especially big week for inflation and interest rates. The Fed (not surprisingly) decided to hold the Fed Funds Rate steady at 1.625% on Wednesday, because they can. Despite unusually low rates, inflation remains tame. Consumer inflation came in up 0.3% overall, more or less in line with expectations, and core inflation was up even less. Producers' input prices were even more contained, with the core PPI figure falling 0.2%. Overall PPI was flat. To put things in perspective, "the" annualized inflation rate now stands at 2.0%, which is right where the Federal Reserve wants it.
Inflation (Annualized) Charts
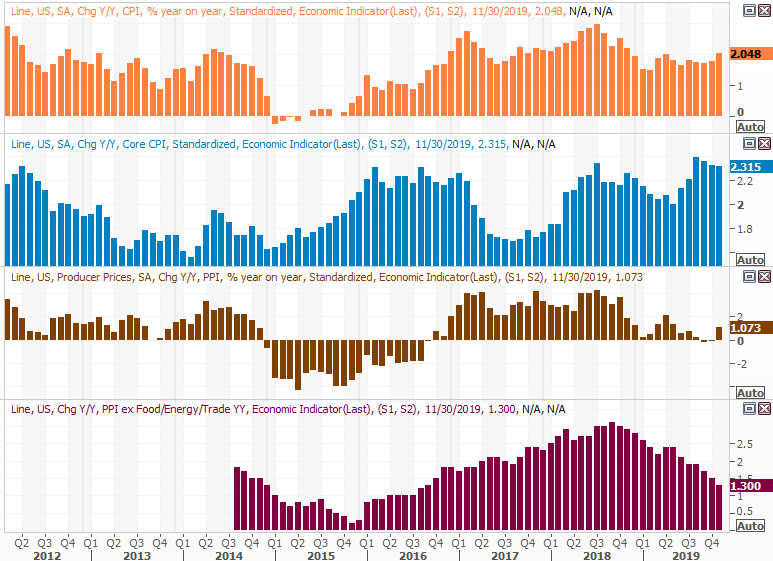
Source: Thomson Reuters Eikon
The other big news last week was November's retail sales, in that they indicates just how confident consumers are feeling. The numbers weren't great. Retail spending not counting cars was only up 0.1%, rolling in well short of the 0.4% increase the pros were calling for. Spending was still 3.2% better on a year-over-year basis, which is good enough to keep the economy going. What's not clear is if consumers can actually fully afford the spending increases they're making.
Retail Sales Charts
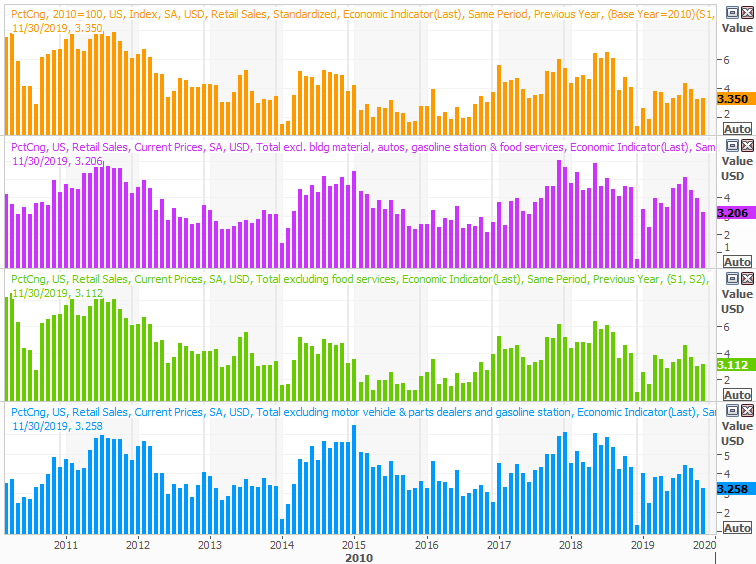
Source: Thomson Reuters Eikon
Everything else is on the grid.
Economic Calendar
(insert 120819-econ-data)
Source: Briefing.com
This week is going to be busier, and more raucous, so buckle up.
The party starts in earnest with what's apt to be the most important yet least watch data set for the next few days... capacity utilization and industrial production. Those numbers coincide closely with earnings as well as the long-term market trend. Unfortunately, both have fallen for a couple of months now, ending a rebound effort from September. Economists are looking for forward progress, but that's not been something investors can count on.
Industrial Production and Capacity Utilization Charts
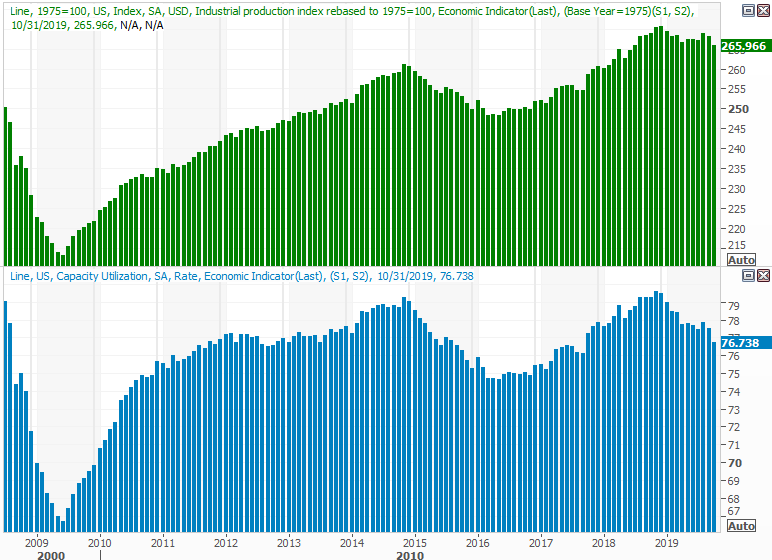
Source: Thomson Reuters Eikon
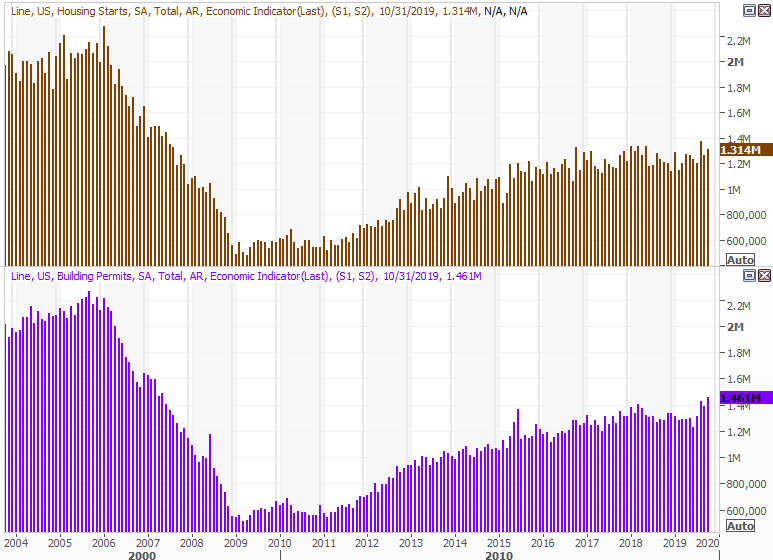
Also on Tuesday look for last month's housing starts and building permits. This was a soft spot earlier in the year, but we've seen rather strong results the past few months largely thanks to lower interest rates. Analysts are looking for more strength this time around.
Housing Starts and Building Permits Charts
Source: Thomson Reuters Eikon
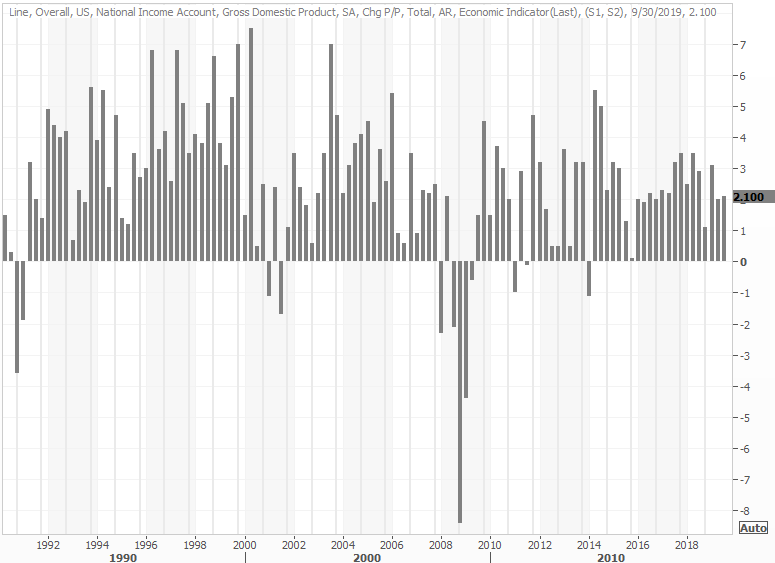
Finally, on Friday keep your ears and eyes open for the third calculation of the third quarter's GDP growth pace. Economists don't think any new information has changed since the last look, when it was 2.0%. That's not red hot, but that tempered pace is actually beneficial in that it helps keep inflation in check.
GDP Growth Chart
Source: Thomson Reuters Eikon
Stock Market Index Analysis
The bulls are charging, but each advance pushes the market closer to its eventual top. If we're not there yet, we're uncomfortably close.
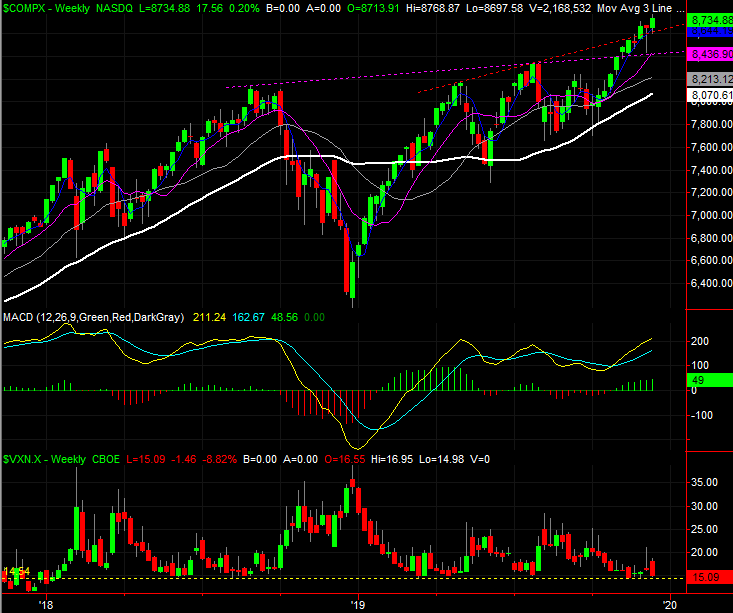
This week's analysis starts with a distant look at the NASDAQ Composite's weekly chart. It's only from this view can we see just how far the market has come since the early October bottom. It's also from this view we can see that, despite last week's gain of 0.9%, the rally is still slowing down. To quantify that idea, the NASDAQ's close of 8734.88 is now 8.2% above the 200-day moving average line (white) at 8070.61, which is about the maximum divergence it's capable of achieving without peeling back.
NASDAQ Composite Weekly Chart, with VXN
Source: TradeStation
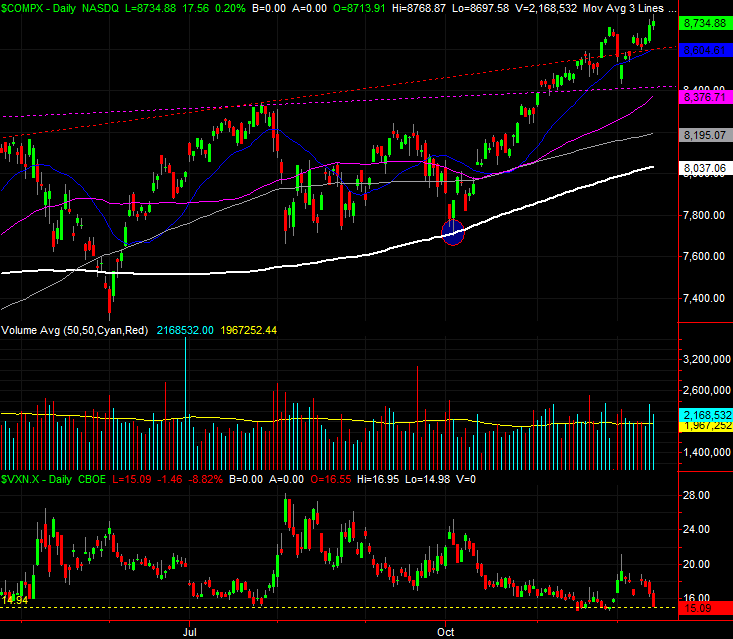
Zooming into the daily chart of the NASDAQ reveals a couple other critical details. One of them is the pullback from the intraday highs from Thursday and Friday. Both days were winners on a close-to-close basis, but both days' closes were well off the intraday high, suggesting the bulls were at least a little bit hesitant. The other critical detail? The VXN is back to what's something of an absolute low around 15.0, which is where it's found a bottom at recent market peaks.
NASDAQ Daily Chart, with VXN and Volume
Source: TradeStation
The flipside: The volume behind the past couple of bullish days was above average, hinting that there may be some decent buying interest after all. Ditto for the S&P 500's daily chart, in both regards.
S&P 500 Daily Chart, with VIX and Volume
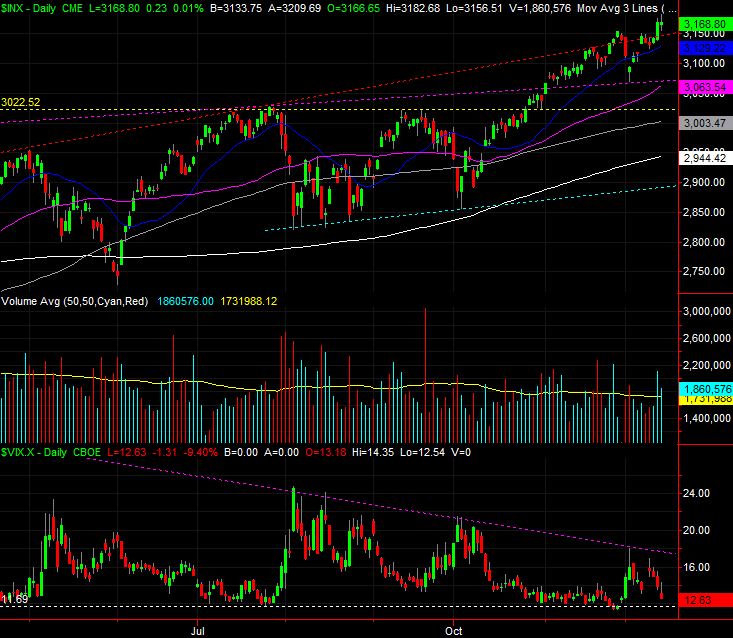
Source: TradeStation
Except, maybe the volume swell from Friday wasn't nearly as bullish as it seemed. Ferreting out the NYSE's up and down volume as well as its advancers and decliners reveals that, despite the S&P 500's small gain, there was a little more bearish breadth and depth than bullish breadth and depth. That wasn't the case at all on Thursday, nor has it been the case for most of the month. Nevertheless, there's been a growing imbalance of the market's advancers and up volume compared to its decliners and its down volume.
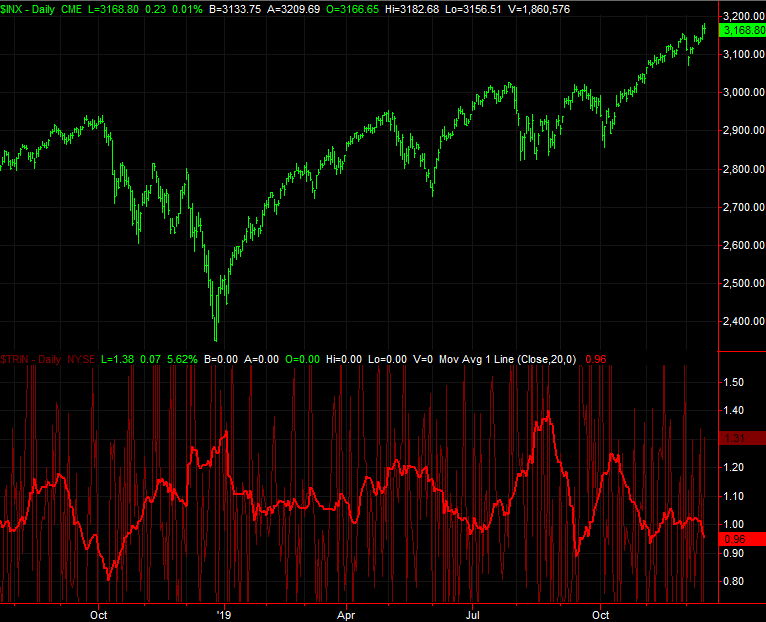
This is best illustrated by the Arms Index, sometimes called the TRIN Index, of the NYSE's daily breadth and depth data. More specifically, it's best illustrated by a moving average of the daily TRIN/Arms Index numbers, which helps identify the broad trend.
The graph below compares the S&P 500 to a 20-day moving average of the NYSE's daily Arms Index value (red). When that indicator gets "too low," it usually marks at least a noteworthy top. The TRIN average is creeping into "too low" area right now, telling is the advance since the beginning of October hasn't unfurled on a healthy balance between volume and breadth (advancers/decliners).
S&P 500 Daily Chart vs. NYSE Arms Index (TRIN)
Source: TradeStation
The downside of reading bearishness into the TRIN reading is simply that it's not a laser-precise timing tool. The stage is set, so to speak, but the bears will need to make a point of tilting the scales in a bearish direction. They'll do it eventually, but they may hold off on doing so until they're done working on their Santa Claus rally.
Whatever the case, the first lines in the sand are clear. The S&P 500's 20-day moving average line at 3129.2 (blue) is a floor until further notice, and past that, the 50-day moving average line (purple) at 3063.5 will likely hold up as support. If and when those lines break, then we'll reassess. First things first though.