Weekly Market Outlook - Down, But Not Out (Again)
To be crystal clear, last week's setback wasn't "just a little volatility." The pullback broke below some key support levels, setting the stage for some more chain-reaction type selling. On the other hand, it's not like we haven't seen the exact same situation take shape before in recent weeks, and end up going nowhere. In other words, the bears didn't deal stocks a death blow.
 We'll take a look at what's still going right and what's now going wrong for the market in a moment, right after we dissect last week's economic news and preview this week's reports.
Economic Data
The only item of any real interest last week was a look at the inflation landscape as of July. In simplest terms, it remains contained... more than enough to give the Federal Reserve time and room to hold off on the next rate hike [the market wasn't planning on one until early next year anyway]. As it stands right now, the overall annualized inflation rate is 1.73%, having fallen several times since the beginning of the year. It seems to be stabilizing around that level too.
Producer and Consumer Inflation Rate (Annualized) Charts
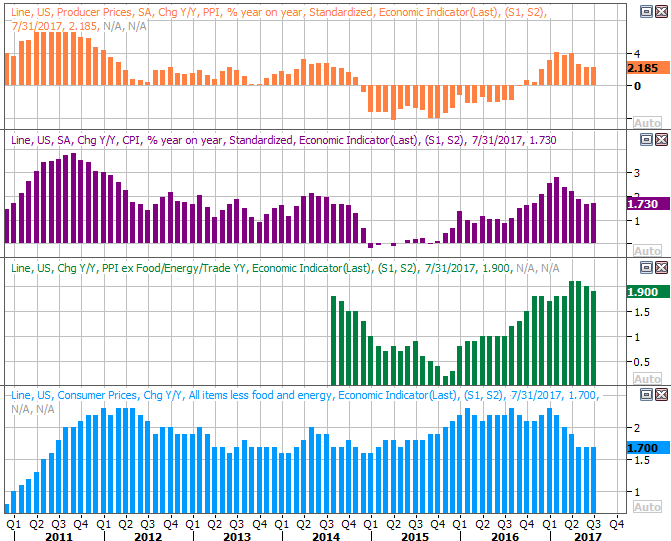
Source: Thomson Reuters Eikon
Everything else is on the grid.
Economic Calendar
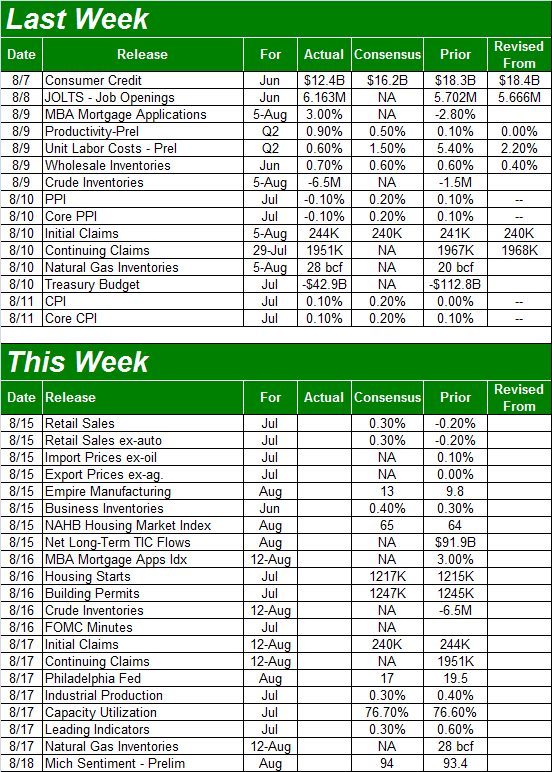
Source: Briefing.com
This week will be a little busier than last week in terms of economic news, though only some of those items are of particular interest.
The party begins on Tuesday, with July's retail sales. The pros think they'll grow 0.3% month-to-month, with or without automobiles factored in. That should keep the overall annualized growth rates around 3.0%. That's healthy.
Retail Sales Growth (Annualized) Charts
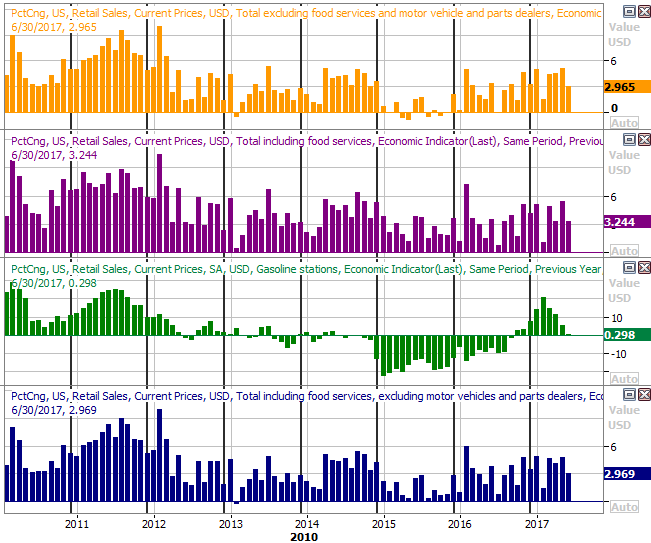
Source: Thomson Reuters Eikon
Technically speaking retail sales growth is slowing down, but that's mostly a function of tougher year-over-year comparisons. As long as retail spending stabilizes at these levels, that's serviceable.
On Wednesday we'll hear about July's housing starts and building permits. You may recall they were slowing over the course of the first half of the year, but surged in June... a much-needed surge. Another strong showing could serve as a confirming catalyst.
Housing Starts and Building Permits Charts
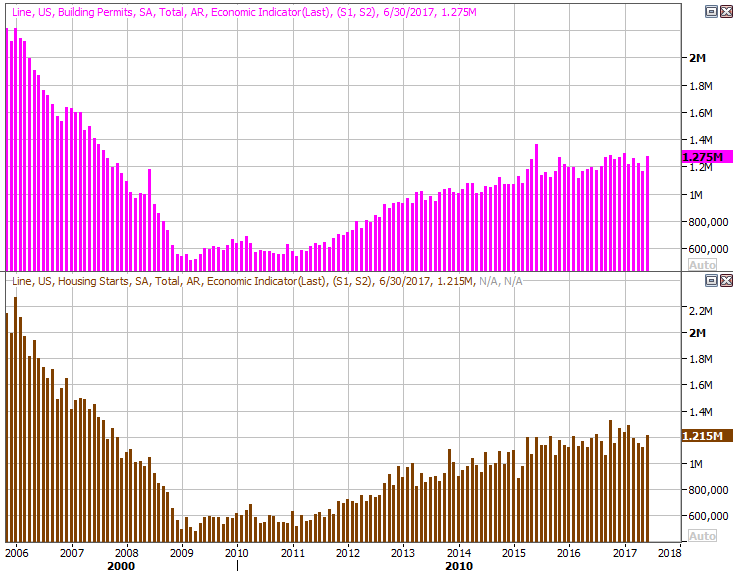
Source: Thomson Reuters Eikon
Also on Wednesday keep your ears open for the release of July's meeting of the FOMC -- that could move the market if something unexpected comes up.
One last thing on Wednesday.... last week's crude oil stock levels. Though it's not one of the data sets we normally keep tabs on, we've been watching it closely of late because oil prices are working on a game-changing rebound, and this is part of that story. It continued a rapid downtrend last week, and another lower reading this week could seal this aspect of the deal.
Crude Oil Stockpile Charts
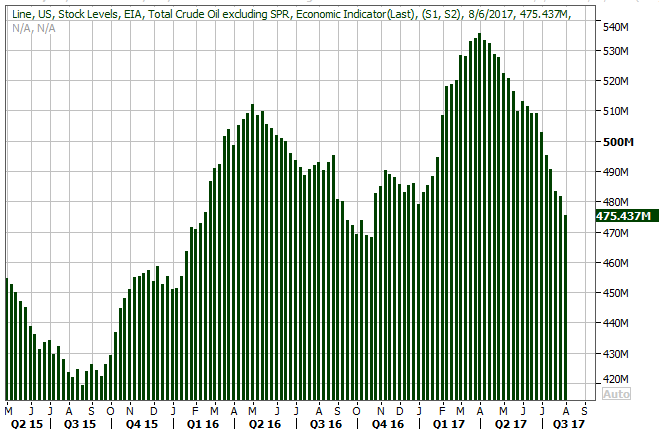
Source: Thomson Reuters Eikon
The last biggie for the week is Thursday's update on the country's capacity utilization and industrial output levels. The connection between corporate earnings and these two data points is significant, as is the correlation between them and the market's broad performance. That's why the 2015 pullback and 2016 trough were a concern. With several months of improved readings on both fronts though, there's lots to be excited about. Economists are expecting more progress to be reported for July,
Capacity Utilization and Industrial Production Charts
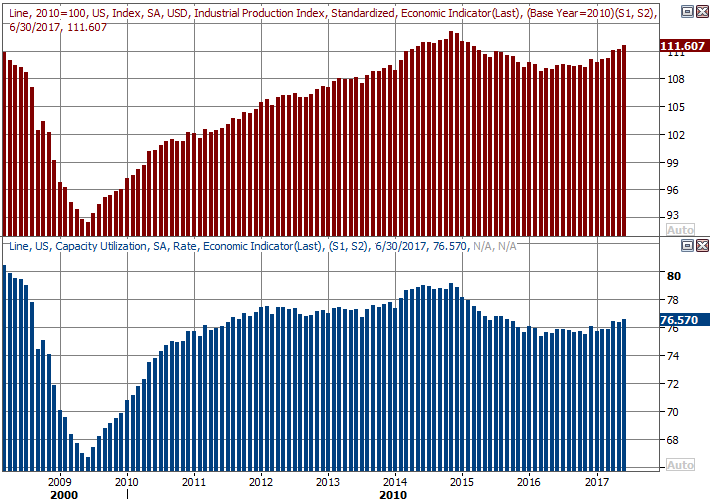
Source: Thomson Reuters Eikon
Index Analysis
Not that we haven't been here several times already in recent weeks (to no bearish avail), but once again the market is back to the brink of a more significant meltdown.
The daily chart of the S&P 500 makes this point as plainly as any image does. On it we can see the index broke below its 50-day moving average line (purple) on Thursday, and didn't crawl back above it on Friday.
S&P 500 Daily Chart
Source: TradeNavigator
Yes, we've seen it before. It happened in March and happened again in May (though not in July), and neither time did the weakness get any traction. With this slight technical weakness though, we're on the verge of a potential meltdown.
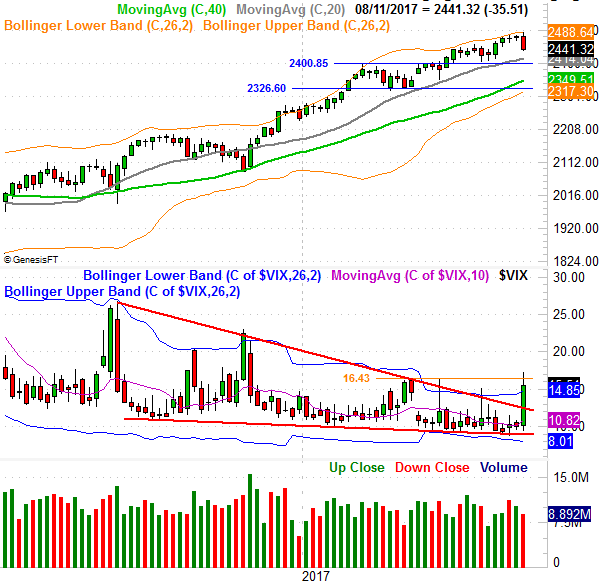
With that as the backdrop, also notice where the VIX is here... knocking on the door of a break above a ceiling at 16.2. It's tried several times since March, but has been unable to clear that hurdle. The possibility remains within reach, however, and we have to respect the possibility that this time really could be different.
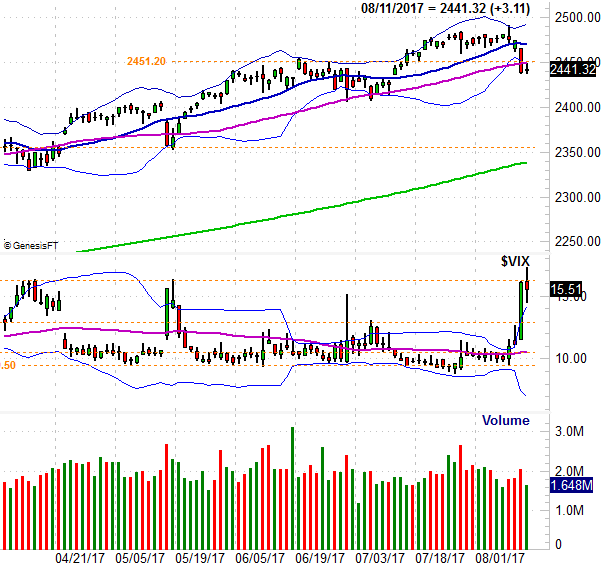
Zooming out to a weekly chart of the S&P 500 and the VIX provides more perspective on the matter. It's in this timeframe we can see just how long the rally has gone without a major correction. It's also in this timeframe we can see the VIX has already broken above a major technical resistance line... the upper boundary of a converging wedge. Also under pressure is that ceiling at 16.2. For one reason or another, traders started taking on a bearish mindset -- with real money, using options -- to a degree they haven't in months. That's a big red flag in itself.
S&P 500 Weekly Chart
Source: TradeNavigator
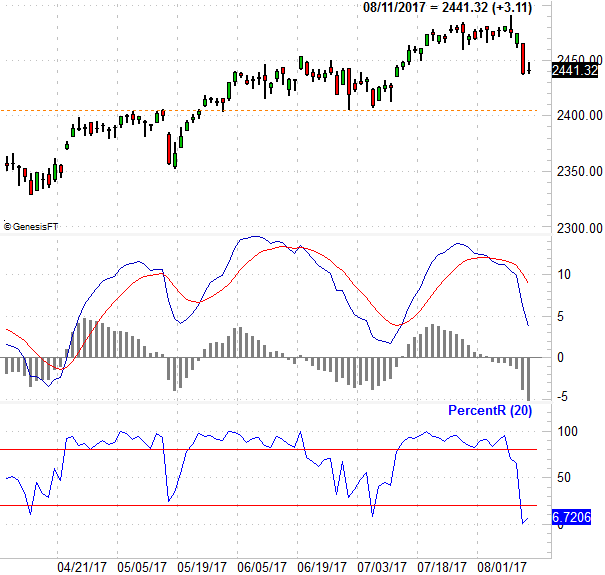
As for what might seal the deal on the budding bearishness, the daily chart of the S&P 500 with a PercentR indicator will provide the most insight.
The 20-day PercentR line is already under the critical 20 threshold, but the bearishness hasn't yet been confirmed. The confirmation will come when the PercentR line itself moves lower again on the same day the S&P 500 makes a lower low. It's a subtle clue, but one that works; you'll notice we never got that clue with any of the other pullbacks this year, and sure enough, none of them never went anywhere.
S&P 500 Daily Chart, With MACD and PercentR Indicators
Source: TradeNavigator
The market isn't beyond salvaging... not even close. Indeed, it's snapped back from worse than this in the recent past. We have to respect all possibilities though, and there's a distinct possibility this could finally be the one that up-ends the bullishness. Underscoring that possibility is the time of year we're at. The usual September weakness usually starts in the middle of August.
On the flipside, all the bearish potential is wiped away by the S&P 500's move back above its 20-day moving average line, currently at 2470.