
The market may have finished last week on a high note. But, it wasn't enough to wipe away the full-week loss. The S&P 500 fell 3.3% last week, reversing two very bullish weeks and at least partially dashing hopes for a firm, brisk recovery. And, stocks hit ceilings right where you'd expect them to. It's too soon to count the rebound effort out just yet. It's not too soon, however, to acknowledge the possibility that the market's got to move lower before moving higher again.
We'll look at these technical ceilings in detail below. First though, let's recap last week's key economic announcements and preview what's coming this week.
Economic Data Analysis
Last week's big news was of course the Federal Reserve's decision on interest rates. As was largely expected, the FOMC upped the Fed Funds rate another 75 basis points. More important than that though, Fed Chairman Jerome Powell confirmed he's willing to continue increasing the Fed Funds Rate as long as inflation remains above the Fed's targeted level. Translation: Look for continued rate hikes for the foreseeable future.
That wasn't the only big news, however. We also got October's jobs report on Friday. Though the country added 261,000 new payrolls last month, the unemployment rate ticked higher to 3.7%.
Payroll Growth and Unemployment Rate Charts
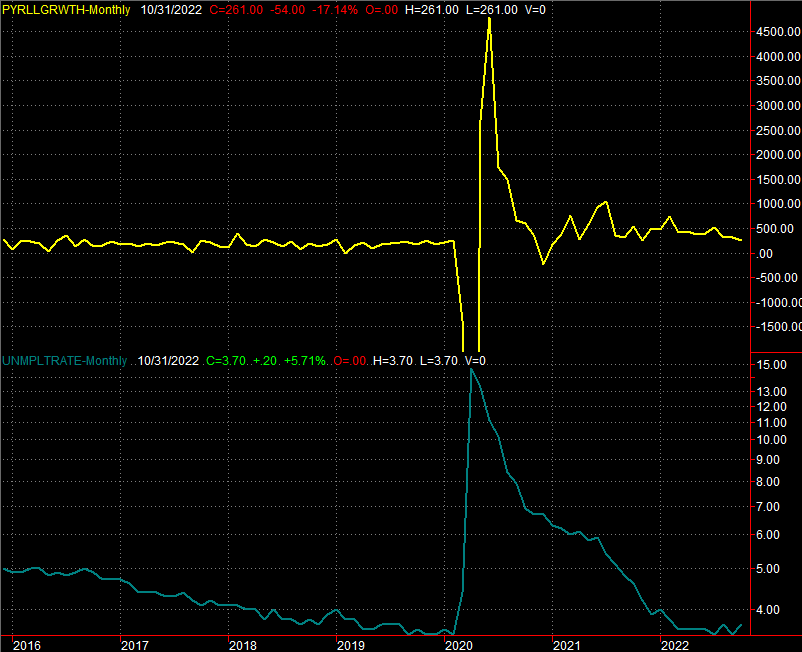
Source: Bureau of Labor Statistics, TradeStation
Yes, it's possible. The unemployment rate is a function of the number of people who are officially unemployed (eligible for benefits) compared to the total number of people in the labor pool. The total number of individuals willing to work didn't change much, but the number of people unemployed grew by 306,000 despite the 261,000 newly-formed jobs.
The only other report from last week that was of any real interest was October's ISM numbers. Although still above the critical 50 mark, both data points from the Institute of Supply Management had been edging lower. And, that didn't change last month.
ISM Manufacturing and Service Index Charts
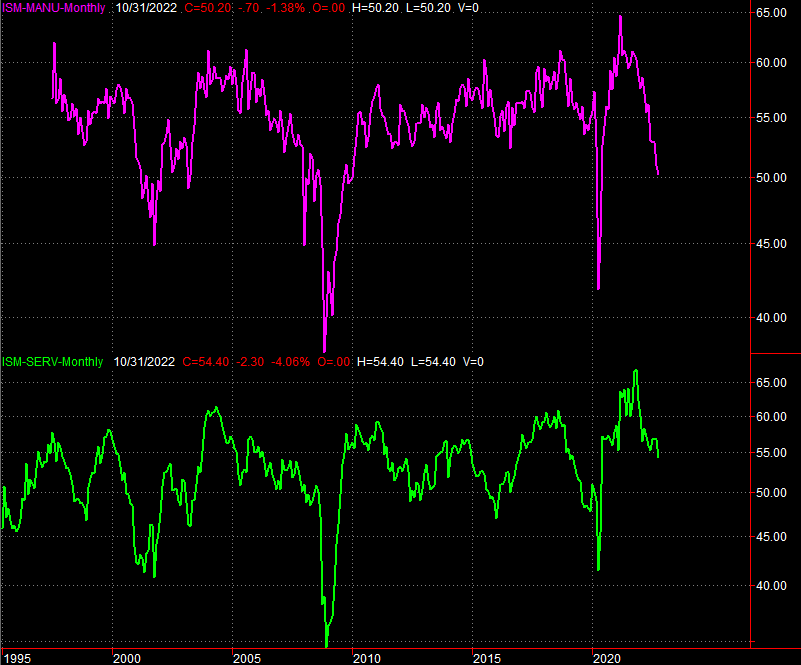
Source: Institute of Supply Management, TradeStation
While both the services and the manufacturing measures both remain above 50 for now, it seems unlikely that will be the case for much longer.
Everything else is on the grid.
Economic Calendar
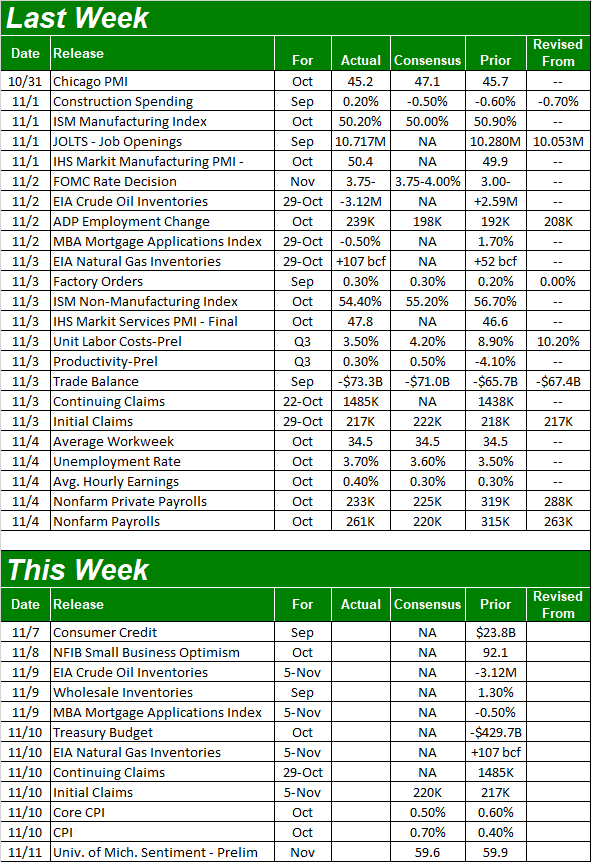
Source: Briefing.com
This week is going to be much simpler. In fact, there's only one report in the lineup we care much about it, and we're only getting part of it. That's the inflation update through October. The consumer inflation report is due on Thursday, and should be up on an overall basis as well as on a core basis for the month... about as much as both have been of late. This is a key part of the reason Jerome Powell remains so clear about the likelihood of continued interest rate increases.
Inflation Rate (Annualized) Charts
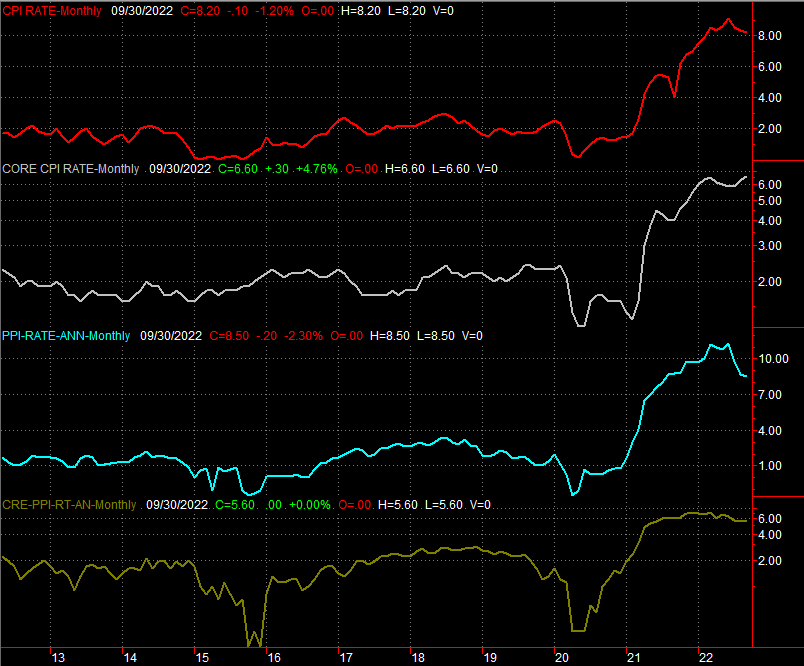
Source: Institute of Supply Management, TradeStation
The producer inflation report is coming on Tuesday of next week. It's likely to show the same degree of price growth.
Stock Market Index Analysis
In retrospect, last week's retreat can't come as a surprise. The market was bumping into established resistance early in the week, and simply failed to clear. It's not the first time it's happened this year.
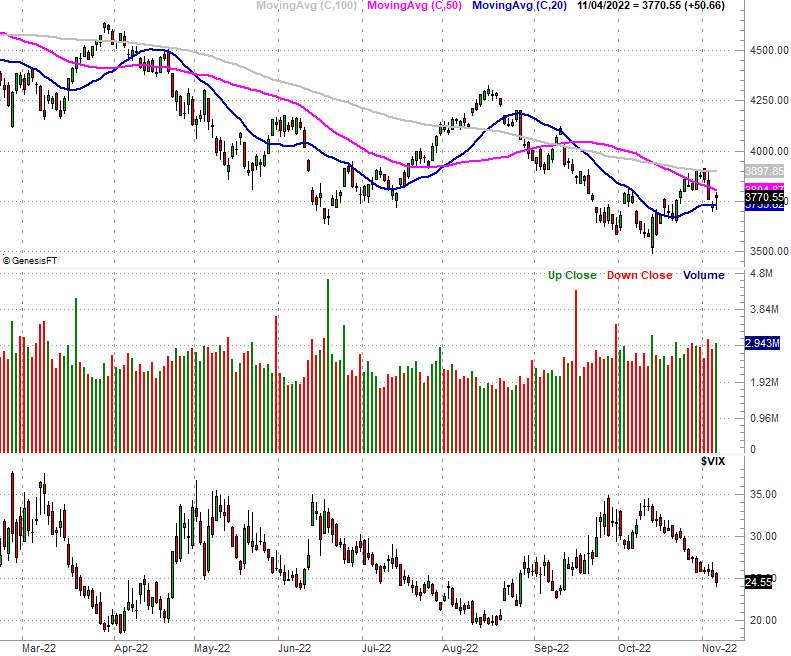
Take a look at the daily chart of the S&P 500 below to see what we meant. The 100-day moving average line (gray) near 3900 was tested on Friday of the prior week as well as Monday and Tuesday of last week. The index just couldn't hurdle it though, up-ending itself on Wednesday.
S&P 500 Daily Chart, with VIX and Volume
Source: TradeNavigator
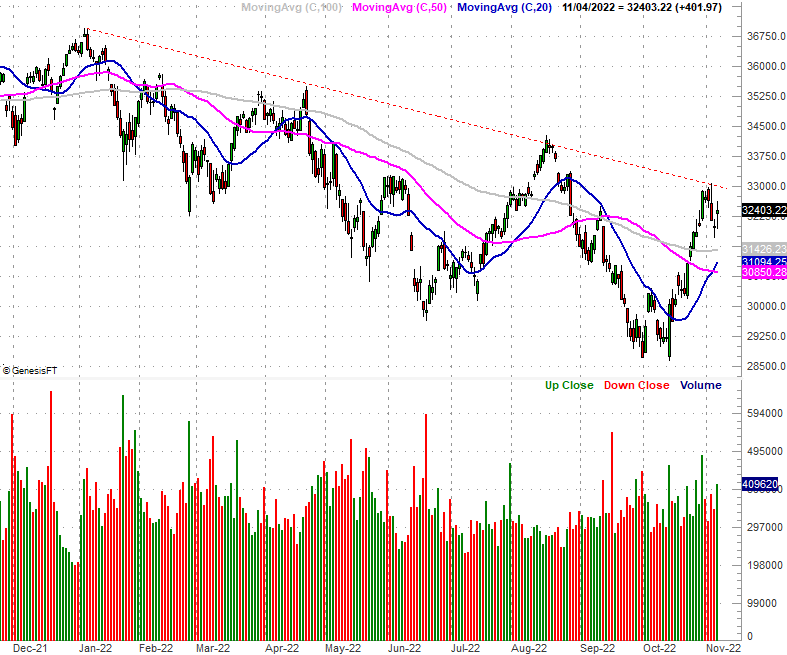
The Dow Jones Industrial Average bumped into resistance of its own. The line that connects all the major peaks since January (red, dashed) was a factor again last week, stopping the rebound effort cold... again.
Dow Jones Industrial Average Daily Chart, with Volume
Source: TradeNavigator
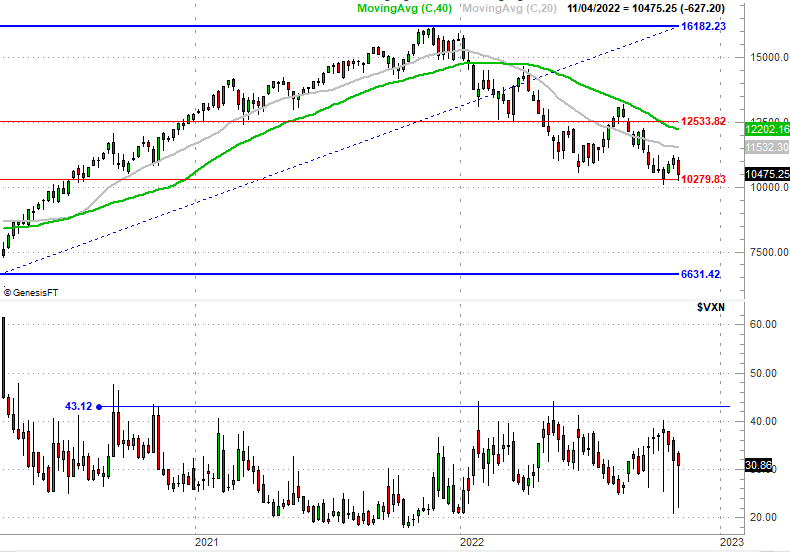
The market isn't quite beyond all hope just yet though. Check out the weekly chart of the NASDAQ Composite. Last week's low of 10,263 is essentially in line with the 61.8% Fibonacci retracement of the rally between the early-2020 low and November's peak. If there was anywhere the bulls would make a stand, this is one of the most likely prospects.
NASDAQ Composite Weekly Chart, with VXN
Source: TradeNavigator
Now go back up to the daily chart of the S&P 500 to see what it didn't do last week. What it didn't do was break under its 20-day moving average line (blue) at 3734. It briefly edged under that level on Thursday and Friday, but never closed under that mark. The bulls seem to have drawn a line in the sand there as well. But, first things first. The indices themselves are currently stuck between support and resistance.
Simply put, things could still go either way here. The overall undertow is still bearish, so the onus is on the bulls. The floors the bears have to break below to inspire another round of selling, though, are crystal clear as well.
The one oddity about this market weakness? The volatility indices -- the VIX and VXN -- aren't playing along as expected. They're both still trending lower, which is what you'd expect when the broad market is still moving higher. Both the VIX and the VXN are also still trapped between support and resistance levels, which we'll want to watch carefully from here as well.