Weekly Market Outlook - Don't Mistake Friday's Bounce For An "All Clear" Signal
Stocks ended the week on a much-needed high note, but keep things in perspective. The week was still a pretty big loser, and even with the gain, all the indices remain below pivotal technical levels. On the flipside, at least all the indices are above some important technical floors. The hardest part here is just waiting for one side or the other to flinch.
We'll look at the matter in detail below, as always. First, let's recap last week's economic new and preview what's in store for this week. Warning! It's going to be a very busy week, capping off with a huge jobs report for September on Friday.
Economic Data Analysis
Not a lot of news last week, but it was a big week for real estate... real estate prices in particular. In short, things still look good - at least through July (the most recent numbers). New homes sales soared to a multi-year high pace of 1.01 million, following an equally impressive surge to June's pace of 965,000. Consumers are taking advantage of low interest rates, but just as impressive is that so many people are able to secure mortgage loans. Although not show on our chart, sales of existing homes ticked higher too, although not to the same degree. Even so, sales of existing homes reached 6.0 million for August.
New Home Sales Chart
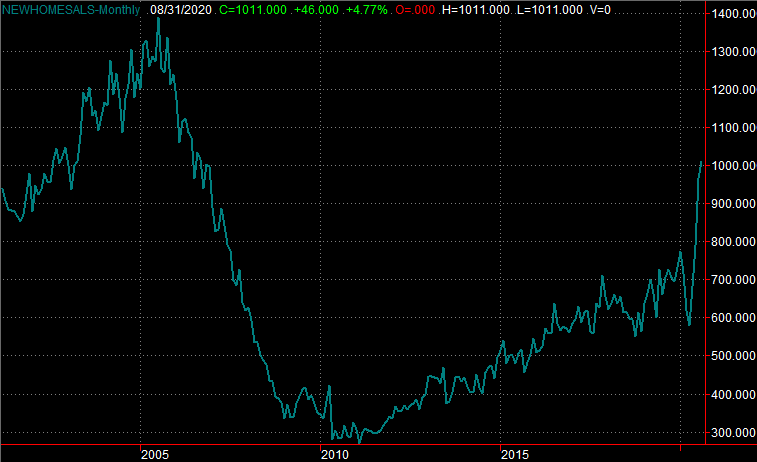
Source: U.S. Census Bureau, TradeStation
In the same vein, housing prices moved up too (for July). The FHFA Housing Price Index was up 1.0% from the previous month, renewing an uptrend that took a brief pause a couple of months ago. We won't get the Case-Shiller Index update until this week, but that measure is apt to have improved like its FHFA counterpart.
FHFA and Case-Shiller Housing Price Index Chart

Source: FHFA, Standard & Poor's, TradeStation
Everything else is on the grid.
Economic Calendar
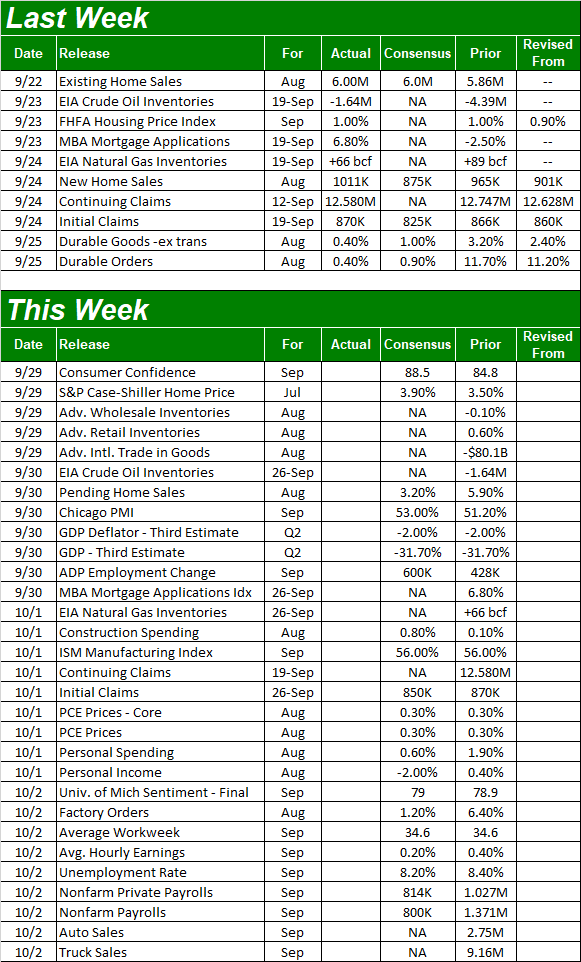
Source: Briefing.com
This week is a loaded one, ending with the September jobs report and September's auto sales figures. First though, keep your eyes peeled for the Conference Board's consumer confidence figure as well as the third and final look at the Michigan Sentiment Index. Optimism hasn't been especially great of late, and forecasters aren't planning on things to get a whole lot better just yet.
Consumer Sentiment Charts
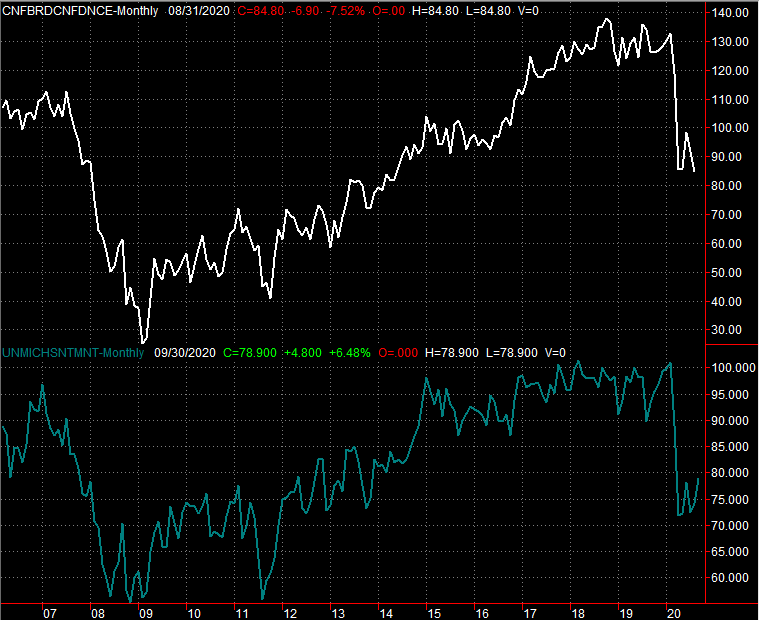
Source: Conference Board, University of Michigan, TradeStation
We'll also get the third calculation of Q2's GDP growth rate. Economists are still pretty sure it slumped by a whopping 31.7% for the three-month stretch ending in June. Don't sweat it too much though. It was COVID-induced, and we're nearing the end of Q3 that's been decidedly different.
On Thursday look for the ISM Manufacturing Index report, though don't look for any change to August's reading of 56.0. Then again, anything above 50.0 is positive.
ISM Manufacturing, Services Index Charts
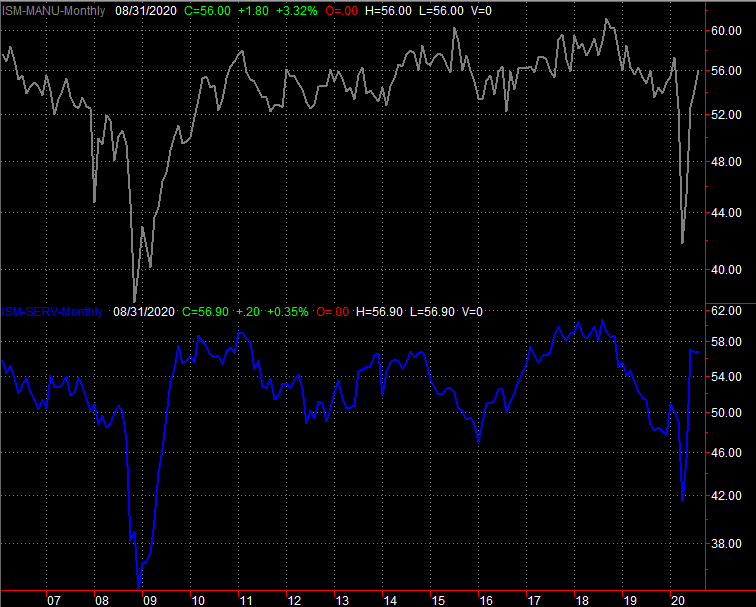
Source: Institute of Supply Management, TradeStation
We won't get the services version of the index until next week, but it has been and should remain firm as well.
The biggie of course is the look at the employment numbers for September, coming on Friday. Economists are calling for a little progress, but not a lot. The unemployment rate should fall from 8.4% to 8.2%, driven lower by the addition of (net) 814,000 new jobs. The easy, low-hanging fruit of jobs recovery is in the past. Things will improve from here, but not nearly as quickly as they have since May.
Unemployment Rate, Payroll Growth Charts
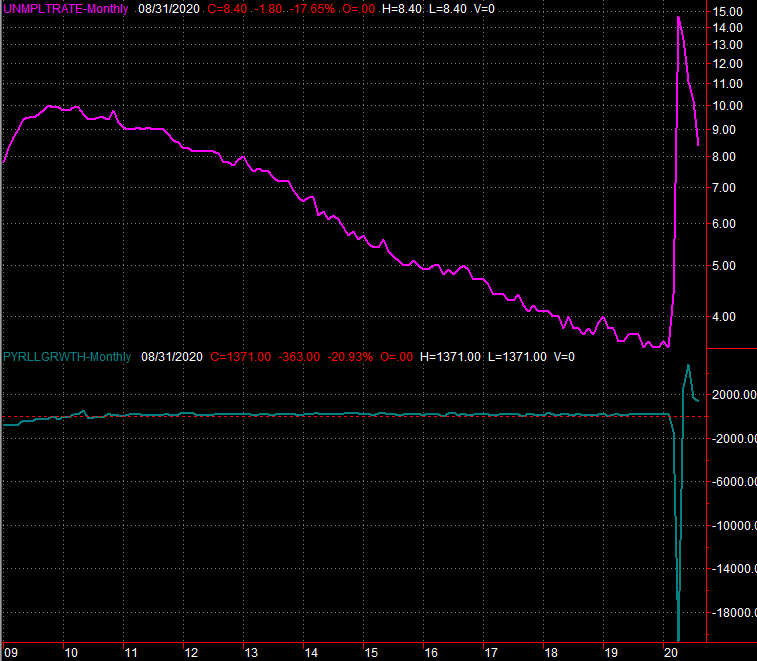
Source: Institute of Supply Management, TradeStation
Stock Market Index Analysis
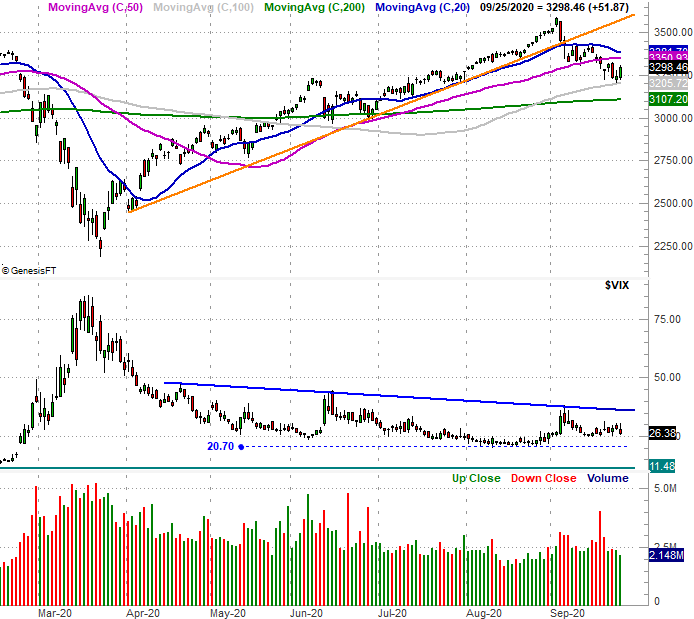
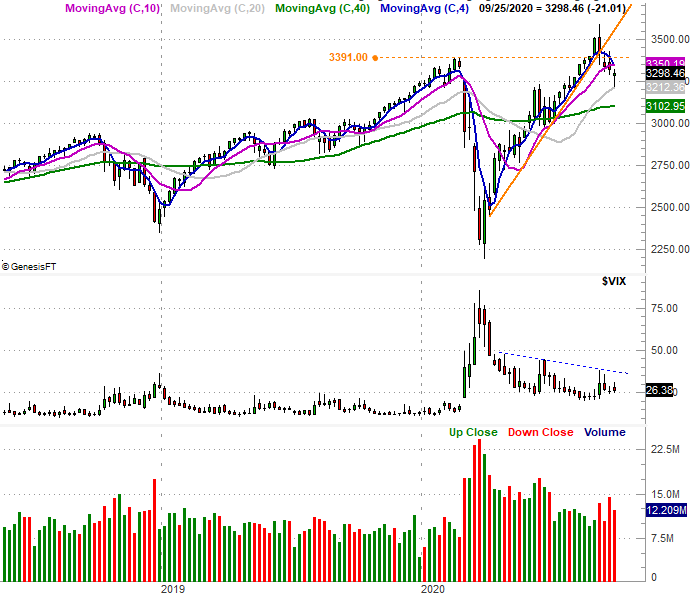
Yes, stocks were up big-time on Friday. The S&P 500 gained 1.6%... the best single day in months. Keep it in perspective though. Even with the rally, the S&P 500 still fell 0.6% for the week, and is still down 6% for the past four weeks. A little bit of bullish pushback could have been expected. It still didn't snap the downtrend. In fact, this is right where that bullish pushback could have expected. It's anything but a new uptrend yet.
Take a look at the daily chart of the S&P 500 to see. Thursday's low essentially kissed the 100-day moving average line (gray), setting the stage for Friday's gain. Even with Friday's gain though, the index remains below its 50-day (purple) and 20-day (blue) moving average line... the latter of which is about to pull under the former. You'll also notice there was very little volume behind the move, suggesting that actual trader conviction with the move was light.
S&P 500 Daily Chart, with VIX and Volume
Source: TradeNavigator
In short, we can chalk Friday's volume up to nothing more than volatility.
The weekly chart doesn't tell us much more, but it does give us some added perspective. It's from this vantage point we can see just how overblown the March plunge was, and how incredible the rebound that began in April was. We can also see how volume was fading all the way up, but started to rise again four weeks ago at the first hint of trouble.
S&P 500 Weekly Chart, with VIX and Volume
Source: TradeNavigator
Perhaps most eye-opening of the weekly chart is what the VIX hasn't done... yet. It's not shot higher, which tends to happen when the market is making a significant low. In fact, the VIX has remained remarkably well contained, staying below a falling resistance line (blue, dashed) that connects the major highs since late-April.
That's not to suggest the VIX absolutely has to spike in conjunction with a sharper plunge for the S&P 500 to clear the decks (so to speak) so it can make a prolonged recovery rally. We only have to look at the end of 2018 and all of 2019 to realize the VIX doesn't always soar at a major low. The VIX can hover near its somewhat-absolute floor while the market continues to inch higher. This is clearly not the same environment as last year though. Aside from the negative impact of the coronavirus pandemic, there's a hotly-contested presidential election process underway. That's a lot of uncertainty, which tends to work against the market.
One also only has to go back to 2018 to recognize that while the market usually rallies in Q4 beginning in mid-October, it doesn't always do so. Sometimes, the fourth quarter can be disastrous even when we're in a bull market.
Context is everything, so we must remain ready for anything.
The other index charts tell the same basic story, but the NASDAQ Composite's chart is giving us something a little more... but not the composite itself. Rather, the NASDAQ Volatility Index (or VXN) is behaving a bit differently than the S&P 500's VIX is. It's trapped in a horizontal trading range (red, dashed). Like the NASDAQ Composite itself, we'll have to wait and see whether it's the floor or the ceiling that fails first.
NASDAQ Composite Daily Chart, with VXN, Up and Down Volume
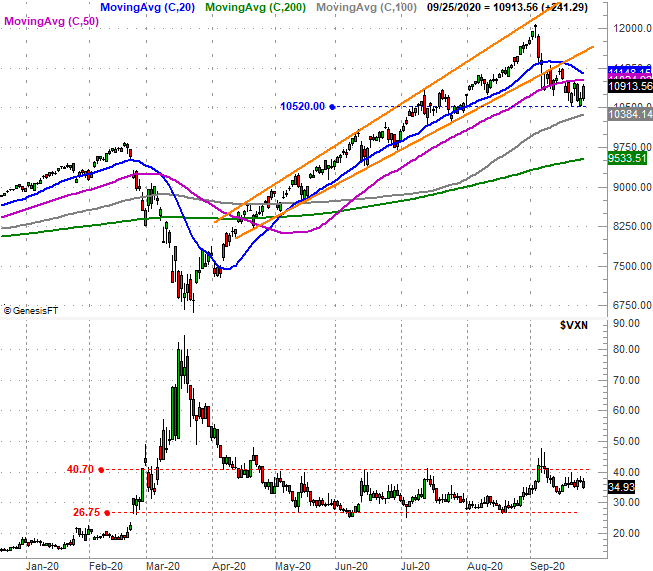
Source: TradeNavigator
The hardest part, of course, is the waiting.