Weekly Market Outlook - Despite Friday, Last Week Was Intoxicating
 The market may not have ended last week's action on a high note, but it doesn't really matter. The first three days of the week were so strong, stocks were still more than able to log a second big week of gains and further solidify the young turnaround effort.
There's still a huge hurdle dead ahead though.
We'll weigh the pros and cons below, as always. First, however, let's recap last week's economic news (there was a biggie) and preview this week's economic announcements.
Economic Data
Last week's biggest news ended up being a non-event, yet it was telling economic news all the same. On Thursday, as expected, the FOMC opted to not raise interest rates by a quarter point. The Fed did say the bigger-picture rate hike plan is still intact, and the odds say they'll be bumped higher next month.
Maybe the Federal Reserve should have pulled the trigger though. We learned on Friday that producers' input prices perked up much more last month than anticipated. The nation's factories and plants said their materials costs were up 0.6% for the month, compared to September's costs, and up 0.5% on a core basis. Economists were only modeling producer inflation of 0.2%. Annualized, core producer price inflation now stands at 2.8%.
Producer, Consumer Inflation Charts
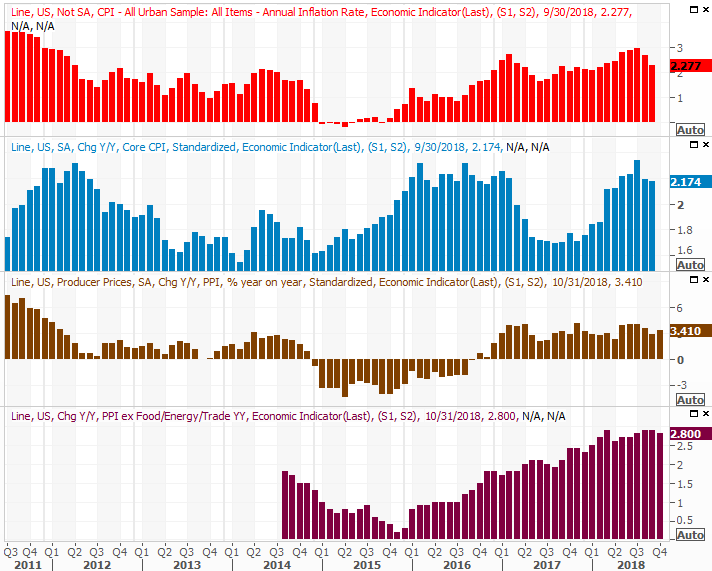
Source: Thomson Reuters
On Tuesday of this week we'll round out the inflation picture with last month's consumer inflation report. The pros are calling for a fairly muted increase there, though in light of the fact that producers paid higher prices than they expected to last month, consumer inflation will likely roll in higher than expected too.
Regardless, notice that with higher year-over-year comps, annual inflation rates are leveling off and even sliding lower.
Also last week we rounded out the ISM data, with the services side of the information being updated on Monday. It fell a little, but was still better than expected. Both measures remain above the critical level.
ISM Index Charts
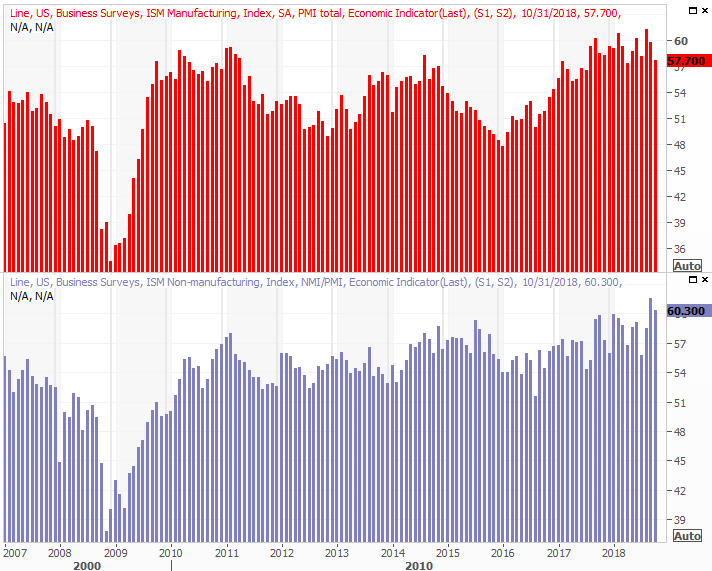
Source: Thomson Reuters
Everything else is on the grid.
Economic Calendar
Source: Briefing.com
This week is going to be much busier, and several of the reports in the queue are heavy-hitters.
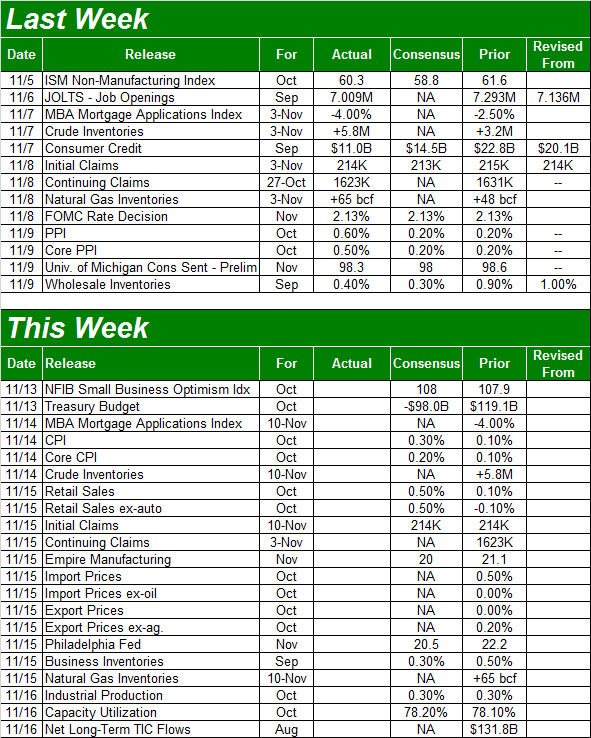
As was mentioned, the rest of the inflation picture will be painted on Tuesday, but the party picks right up again on Wednesday when we hear last month's retail sales numbers. Analysts are expecting a nice uptick after a lackluster September, though we'll reiterate that the numbers touted by the media are month-to-month figures. Our year-over-year figures mean so much more, and as the graphic shows, growth is still solid. It's tapering off, but that's more a function of tougher comparisons. Any annualized spending growth in excess of 4.0% is healthy.
Annualized Retail sales Growth Charts
Source: Thomson Reuters
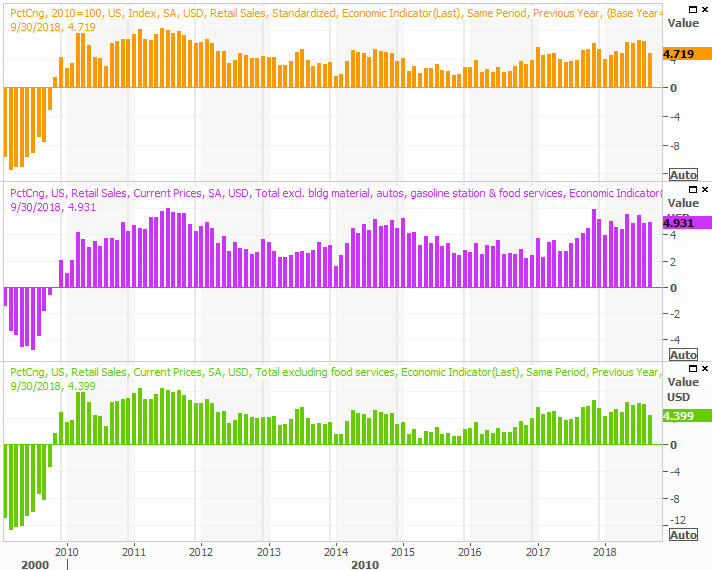
The week's grand finale is last month's capacity utilization and industrial productivity report.
We've mentioned before how strong the correlation between corporate earnings and the long-term direction of the market and this data is, but it merits repeating now. And, that's why we're still broadly bullish despite a couple of dents the market has seemed to suffer of late. Capacity usage and industrial output are both trending higher, and the experts are looking for a continued rise for October.
Industrial Productivity and Capacity Utilization Charts
Source: Thomson Reuters
Let's see if the economic growth can keep the trend alive.
Index Analysis
Will it, or won't it? Can the market follow through enough on the recent rebound effort to get all the way over the hump, or will the bears be able to shut the effort down before it gets going in earnest?
Most signs say this is the real deal... that the advance will continue to chip away at technical ceilings and lead the market to its usual November/December bullishness. It would be naive to ignore a couple of key flaws in the rebound thus far, however.
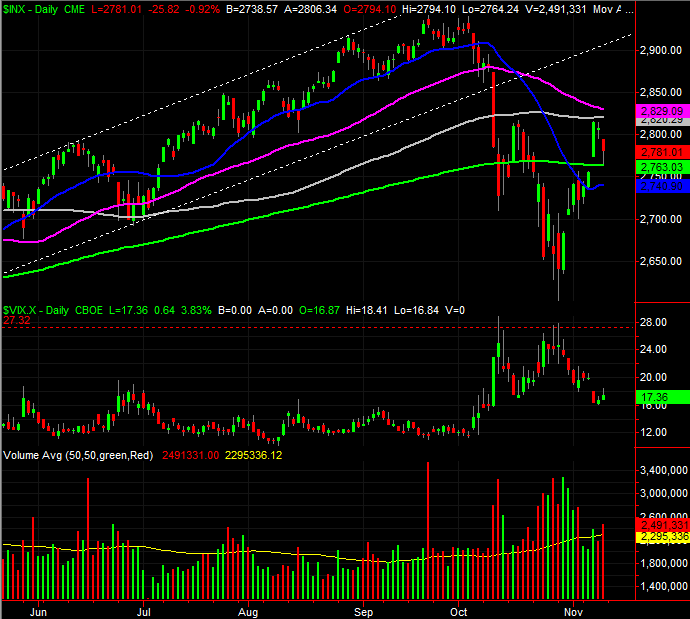
The daily chart of the S&P 500 tells us almost all we really need to know about the current state of the market. Though stocks lost ground on Friday, who can blame the profit-takers? The index gained 2.1% on Wednesday, and as of Thursday's close was up more than 3.0% for the week. There was some wiggle room to use without breaking the uptrend.
S&P 500 Daily Chart, with Volume
Source: TradeStation
And thanks to Wednesday's big move, the index is also back above the critical 200-day moving average line (green)... the same line that appeared to keep the S&P 500 from sliding into too much trouble on Friday. The VIX is also trending lower, but has more room to keep falling.
That's the good news, though there are some concerns too. Most notable is that the index peeled back before pushing above the 100-day (gray) and 50-day (purple) moving averages. There's also a gap left behind with Wednesday's big move; the market generally doesn't like to leave gaps behind (though there are exceptions).
Zooming out to the weekly charts puts all of those things in perspective. It's also on the weekly chart we can't help but notice how tepid last week's volume was. It was, curiously enough, a lack of bullish volume behind the gains early in the week that was the culprit. The highest volume day was the selloff on Friday. Confidence in the rebound effort might not be sky-high.
S&P 500 Weekly Chart, with Volume
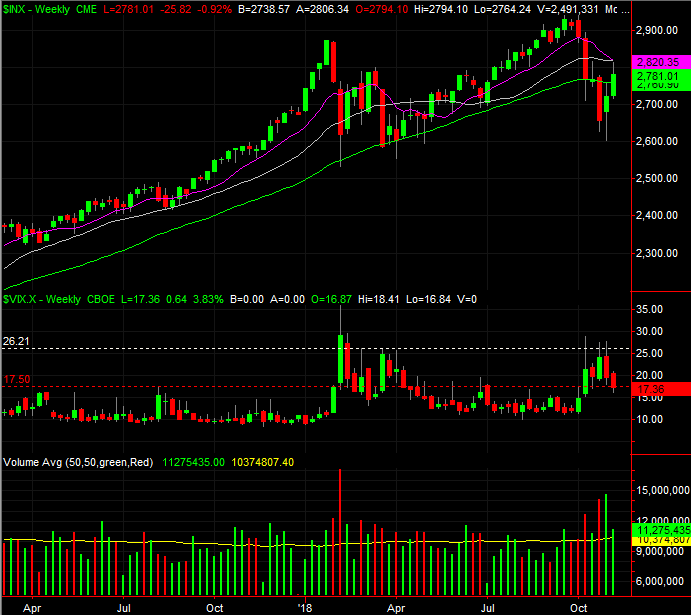
Source: TradeStation
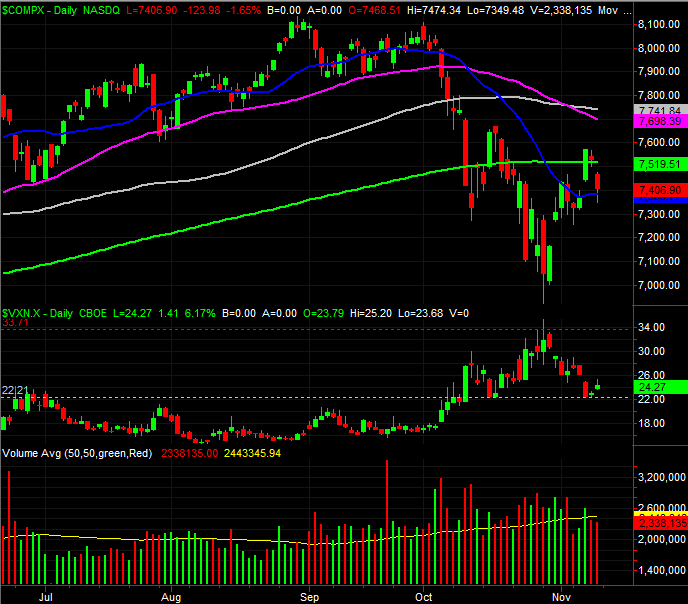
The NASDAQ Composite has more in common with the charts of the S&P 500 than not, though the two aren't identical.
NASDAQ Composite Daily Chart, with Volume
Source: TradeStation
This isn't a tough situation to figure out. The market is caught between a rock and a hard place. It's above some key technical floors but still above some major technical ceilings, against a backdrop of an excessive pullback in October and an excessively-rapid rebound so far this month. It could take several more days for the dust to settle. In fact, that would be ideal. Once that happens any subsequent move would be a new trend you could trust. The moving average lines will be the key lines to watch, as they've trapped the indices.
It wouldn't be wrong to hold off on making a major stance here, and letting more of the market's players tip their hand. When all is said and done though, it's difficult to think we won't see the typical year-end bullishness emerge from the October bottom.