Weekly Market Outlook - Dangerous Lack of Fear, or Just Rock-Solid Bullishness?
 Stocks were overbought headed into the beginning of last week, but investors didn't care. Thanks to last week's 0.5% advance (all of which, and more, was reaped on Friday), the S&P 500 is now up 23.7% from December's low. That's one of the biggest sixteen-week gains on record.
Stocks have been more overbought before. Indeed, they were more overbought even well before September's peak that turned into a Q4 rout. It's possible the move could keep on chugging. If it does though, it's doing so against the odds, and in spite of a seemingly dangerous lack of fear.
We'll explain that argument in a moment, after recapping last week's economic reports and previewing this week's announcements.
Economic Data Analysis
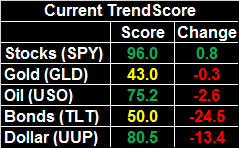
There actually wasn't a lot of data posted last week that really mattered. Above all else we got a complete look at the economy's inflation picture. Producers and consumers are both facing higher prices, but more than that, they're facing price increases that were much higher than expected. This is the case across the board, with and without counting food and energy costs. "The" inflation rate now stands at 1.86%. That's still below the Fed's target rate of 2.0%, but it's also rising at a time when the Fed made a point of not putting a rate hike in place on fears that the economy couldn't stand up to a rate hike.
Producer and Consumer Inflation Charts
Source: Thomson Reuters
To that end, last week's release of the minutes from the most recent FOMC meeting explicitly suggested the governors were concerned about the adverse impact of putting a rate increase in place at this time.
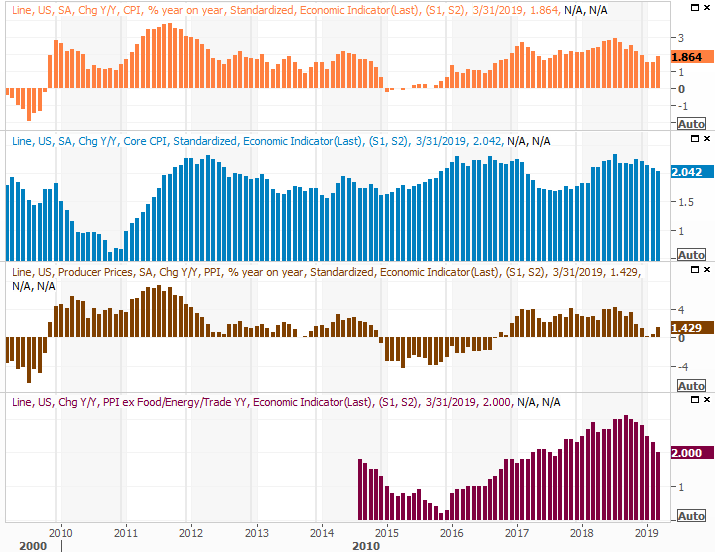
The only other item of real interest from last week wasn't exactly a heavy-hitter, though noteworthy all the same. That's an updated look at crude oil and natural gas inventories, which became more interesting given the solid rebound in crude oil prices. Gas stockpiles ticked higher as the heating season comes to a close, but the bottom was a multi-year low. Crude oil prices, meanwhile, pushed higher in a pretty big way for a third week in a row to reach multi-month highs.
Crude Oil, Natural Gas Inventory Charts
Source: Thomson Reuters
The increase in inventory levels doesn't jibe with rising oil prices, though rising oil prices do generally jibe with consumption outlooks. The balance point, however, isn't entirely clear at this time.
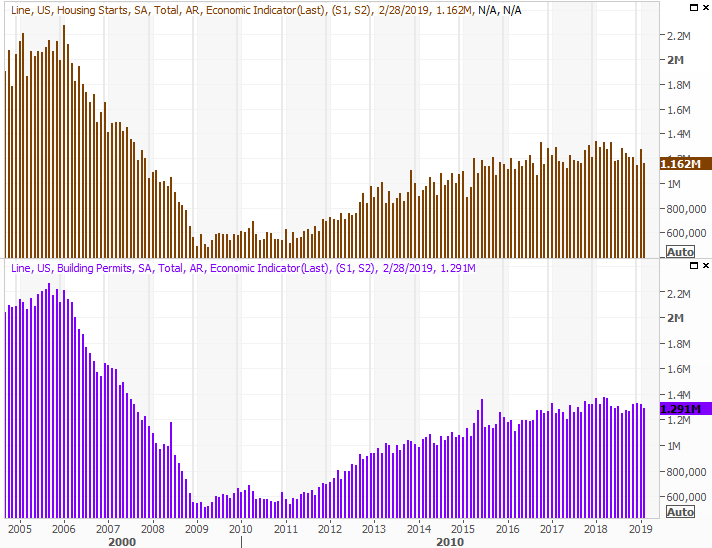
Everything else is on the grid.
Economic Calendar
Source: Briefing.com
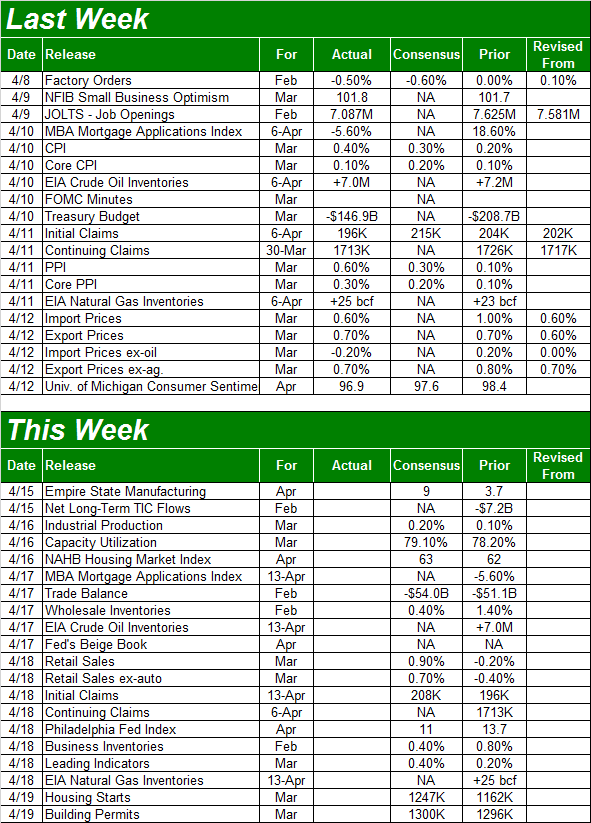
This week will be busier and harder-hitting, starting with a biggie that goes mostly ignored. That's Tuesday's industrial production and capacity utilization report for March. The pros are calling for some pretty strong improvements after a couple of months of stagnation that probably stemmed from the government shutdown. If we meet or exceed expectations, it may portend strong first-quarter earnings reports.
Industrial Production and Capacity Utilization Charts
Source: Thomson Reuters
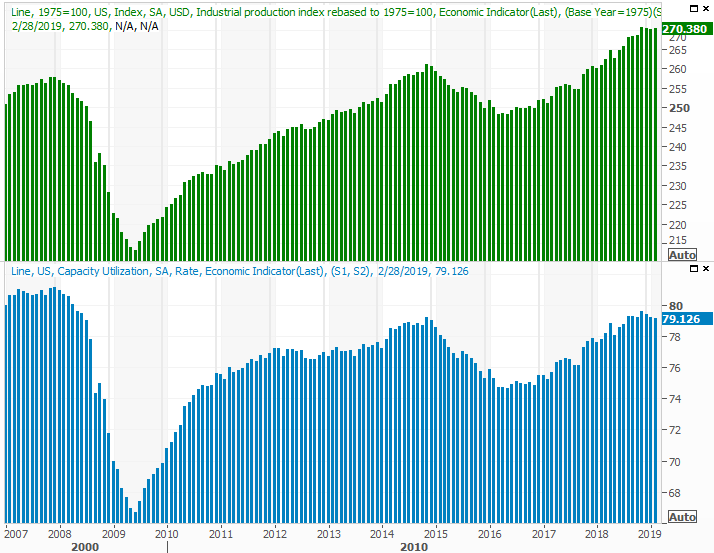
On Thursday look for March's retail sales figures.
You may recall that in December we saw such a strong setback that some experts suspected the data was errant. The numbers did improve - relatively - in January and February, but were still somewhat tepid. Economists are looking for the big recovery to take shape in March, with spending projected to grow a whopping 0.9% month-to-month. Falling short of that outlook could prove problematic for stocks.
Retail Sales Growth Charts
Source: Thomson Reuters
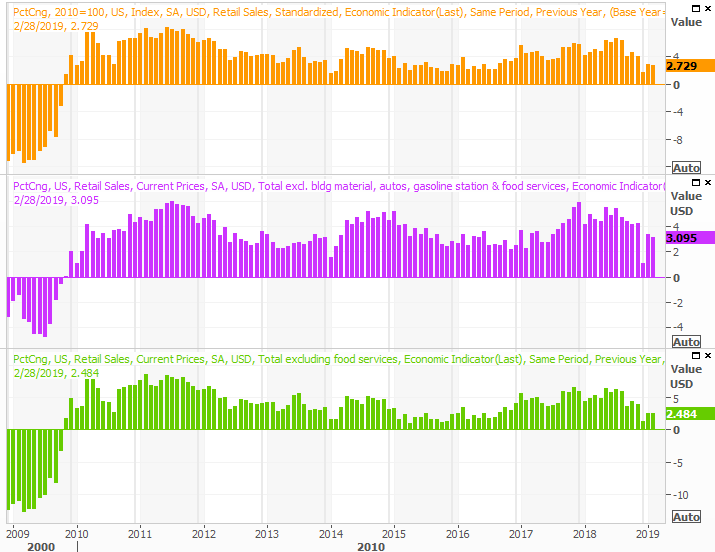
Finally, on Friday keep your eyes peeled for last month's housing starts and building permits reports. We need a strong one here, but the pros are only calling for a modest improvement.
Housing Starts and Building Permits Charts
Source: Thomson Reuters
It remains to be seen how the market will respond to any plausible starts and permits data.
Stock Market Index Analysis
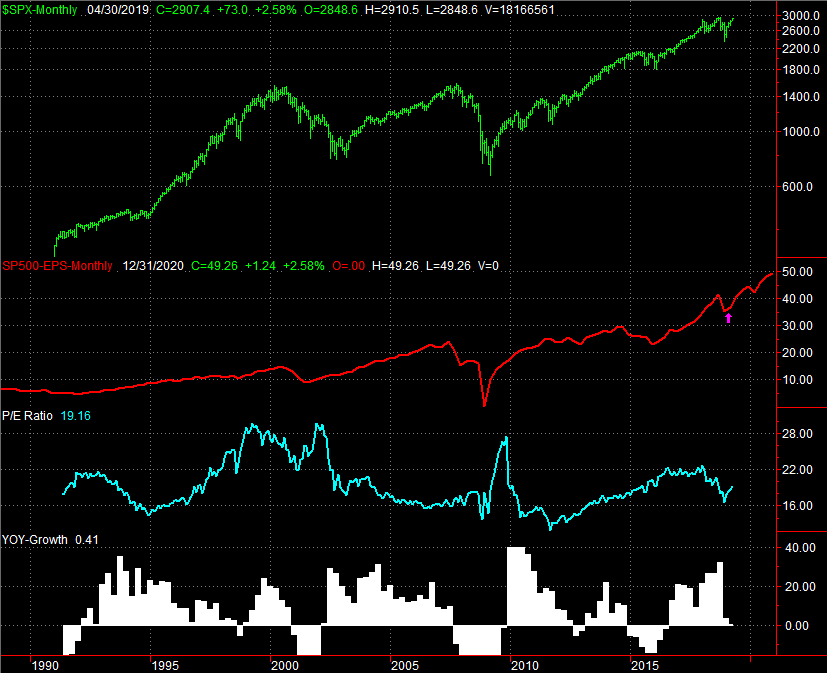
As of the most recent numbers, the S&P 500 is valued at a trailing P/E of 19.16 and a forward-looking P/E of 17.0, thanks to the incredible rally since late December. The trailing figure isn't as high as it was for the better part of 2016, 2017 and 2018, but it remains above the long-term norm. The projected valuation also suggests investors are counting on future earnings that may be a little better than currently expected.
S&P 500 EPS, P/E Chart
Source: TradeStation
That's a somewhat risky bet, given that earnings haven't lived up to expectations from six months out (and longer) for several years now.
That's not a guarantee of a pullback now. We've seen the market's valuation ceiling reach and hold at 22.0 for long periods of time. The S&P 500 could reach 3338 before valuation becomes an overwhelming problem. Still, there's room and reason to expect a pullback given how overbought the market is here.
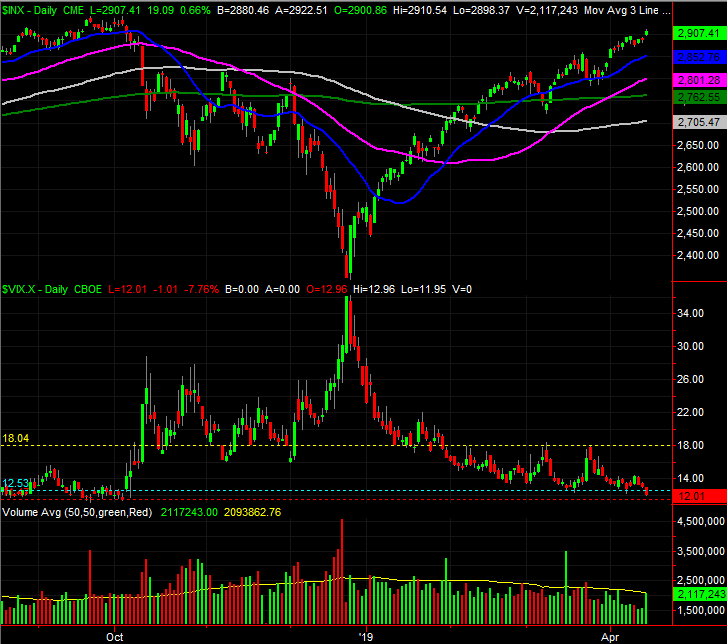
The weekly chart of the S&P 500 puts things in perspective. The past sixteen weeks have been amazing, but not especially well-paced. They're also rooted in unhealthy levels of confidence. The VIX is now at a semi-major floor at 11.1 (though the absolute floor at 11.5 has yet to be touched. The VIX could make its way all the way to that support before the rally just completely runs out of support, but it doesn't have to happen that way.
S&P 500 Weekly Chart, with Volume
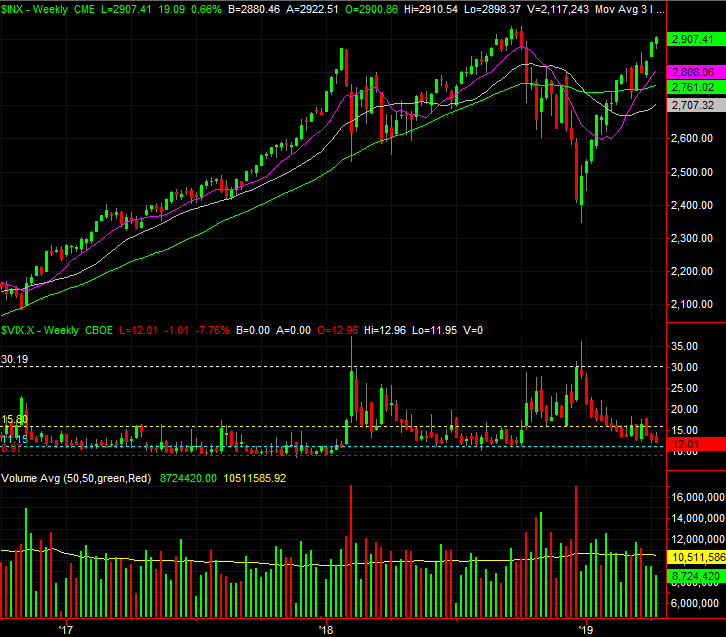
Source: TradeStation
Notice also that while the market may be rising, the volume behind the rally continues to wane. Investors are increasingly afraid to buy the higher stocks go, even though that doesn't jibe with the ever-falling VIX.
The same basic story applies to the NASDAQ and the VXN.
NASDAQ Composite Weekly Chart, with Volume
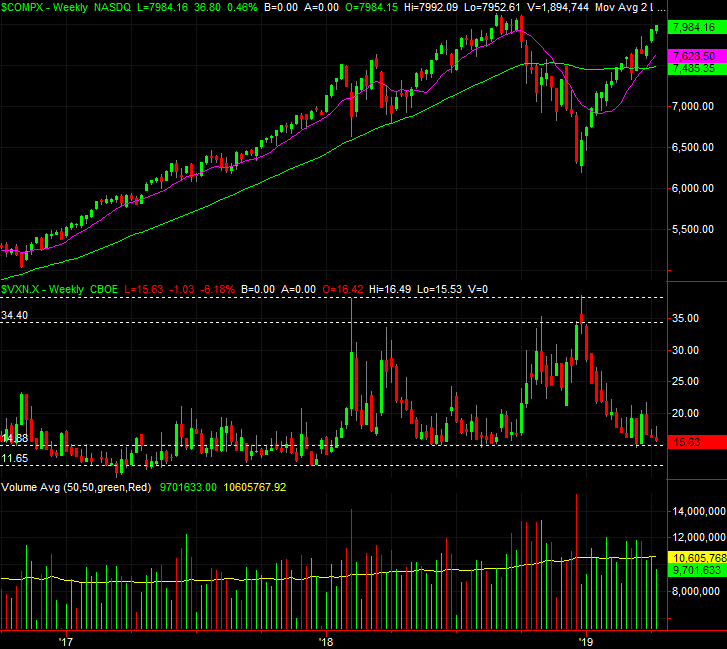
Source: TradeStation
Zooming into the daily chart of the S&P 500 doesn't actually show us a whole lot more, but it does make one matter clear enough - even with Friday's surge, the momentum is slowing. That tends to happen at this point. The S&P 500 is now 5.2% above its 200-day moving average line (green). In early October, it was just a bit under 6% above the 200-day line. We're near yet-another absolute/extreme in terms of how far the market can go before running into a wall.
S&P 500 Daily Chart, with Volume
Source: TradeStation
Frustratingly, there's no amount or kind of technical analysis here that can supersede or override the fact the market remains hijacked by sentiment, which changes every day in response to headlines. Investors only care about valuation and traders only care about the technical situation when they want to. When either group really wants to latch onto a bullish or bearish argument based on news developments though, that's what they're going to do.
The odds of downside are greater than odds of more upside, but that doesn't necessarily mean any weakness will take shape now. And, there's no clarity as to where any pullback might stop. Any of the four moving average lines could act as support.
More than anything, keep an eye on the VIX and the volume data. Namely, should the VIX break above resistance at 18.0, that's likely to be the beginning of more serious weakness that would ideally coincide with a break (or breaks) below the aforementioned moving averages.
This remains a day-to-day dance. Assume nothing.