Weekly Market Outlook - Coronavirus Supplied the Nudge, But Stocks Were Already Vulnerable
It's not as if the market was ever firmly bullish one at any point over the past four trading days (remember, Monday was MLK day). But, Friday's sizeable setback sent a clear reminder to all traders that they can't turn their back on stocks for a single second. Although the indices aren't yet past the proverbial point of no return, the bearish end to last week should at least serve as a red flag.
We'll take a detailed look at what's wrong and how the bears could cause serious trouble below, as always. First, however, let's run down last week's economic announcements and preview this week's biggies. It's a big one, with the first look at Q4's GDP growth in the lineup.
Economic Data Analysis
It was a fairly quiet week, though we did get a couple of good glimpses of the real estate market's health. Sales of existing homes ticked up to an annualized pace of 5.54 million, topping expectations. And, in the same vein, the FHFA's housing price index improved the expected 0.2% between December and November.
New, Existing Home Sales with Inventory Levels
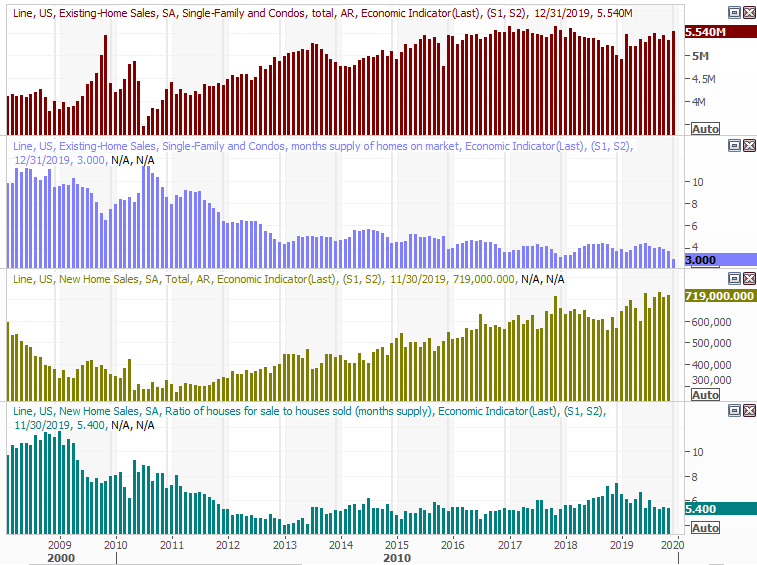
Source: Thomson Reuters Eikon
Home Price Charts
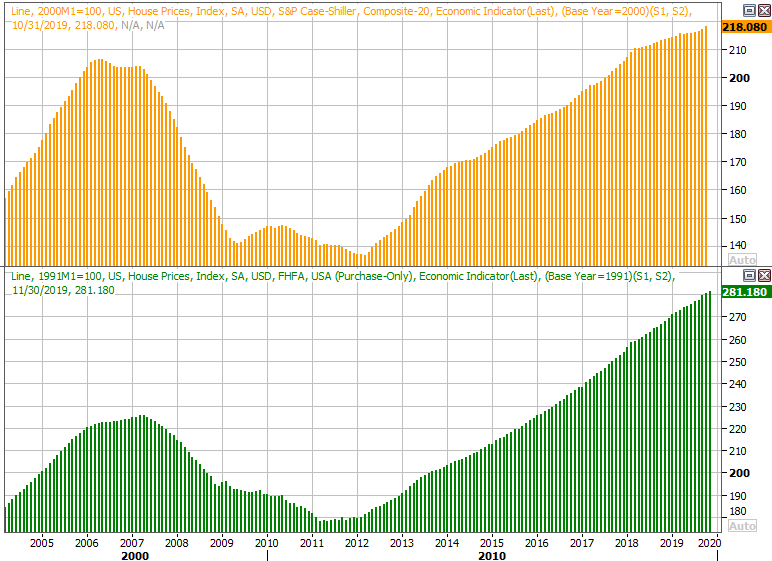
Source: Thomson Reuters Eikon
Note that last month's new-home sales and November's Case-Shiller Home Price Index will be updated this week. As was the case for existing homes and the FHFA's measure of home values, economists are looking for slight improvements for these last two real estate data points.
Everything else is on the grid.
Economic Calendar

Source: Briefing.com
This week will be a particularly telling one for consumer sentiment hawks. The pros are calling for a healthy increase in the Conference Board's measure, while the third and final reading for the Michigan Sentiment Index suggests another good month has been logged. Both have flattened, but they've done so near their reasonable upper limits.
Consumer Sentiment Chart
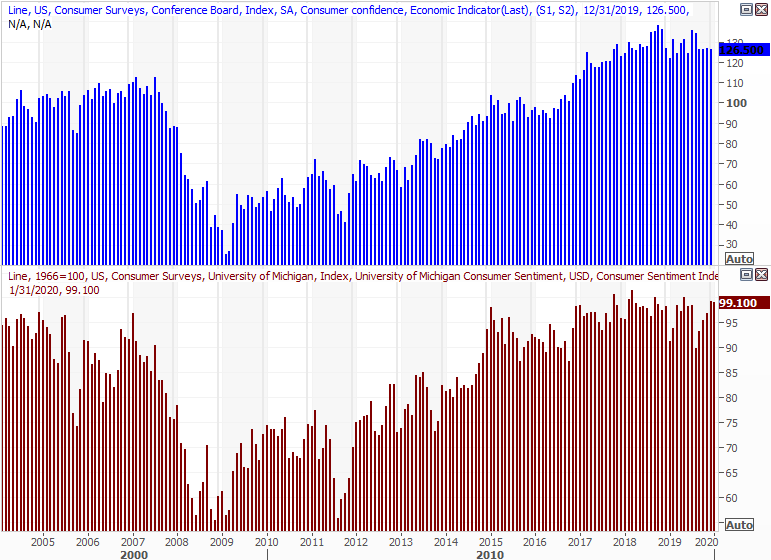
Source: Thomson Reuters Eikon
Sentiment measures are apt to be secondary this week, however. Far more watched and far more important will be the first look at Q4's GDP growth rate, and the Federal Reserve's decision about interest rates. The odds are firmly against any change in the Fed Funds Rate target, which is now meant to hold between 1.5% and 1.75%. And -- and reflective of that dovishness -- economists believe the quarterly GDP growth rate will fall from Q3's 2.1% to 1.8% in Q4. That's still healthy, but not exactly the kind of pace that drives the sort of earnings growth investors have priced into stocks since the latter half of last year.
GDP Growth Rate Chart
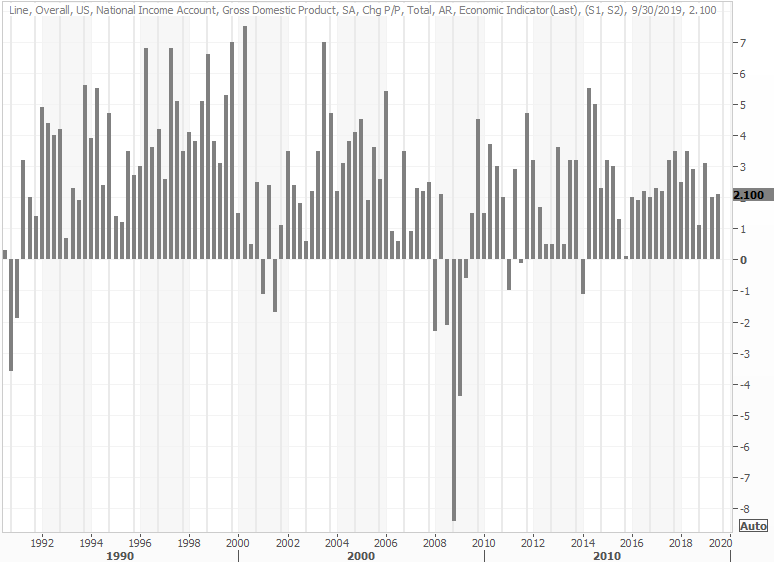
Source: Thomson Reuters Eikon
Stock Market Index Analysis
We'll start this week out with a detailed look at the daily chart of the S&P 500, just to focus on one big thing. But, first things first.
In retrospect, the near-17% rally from October's low should have been suspect to begin with. The market can and does make such moves, but they're rare, and usually result in a rather punitive correction. That's not to say they start bear markets, but traders lost perspective. Earnings growth is fairly stagnant, as is economic growth. The bulls charged anyway, but that advance was always on borrowed time.
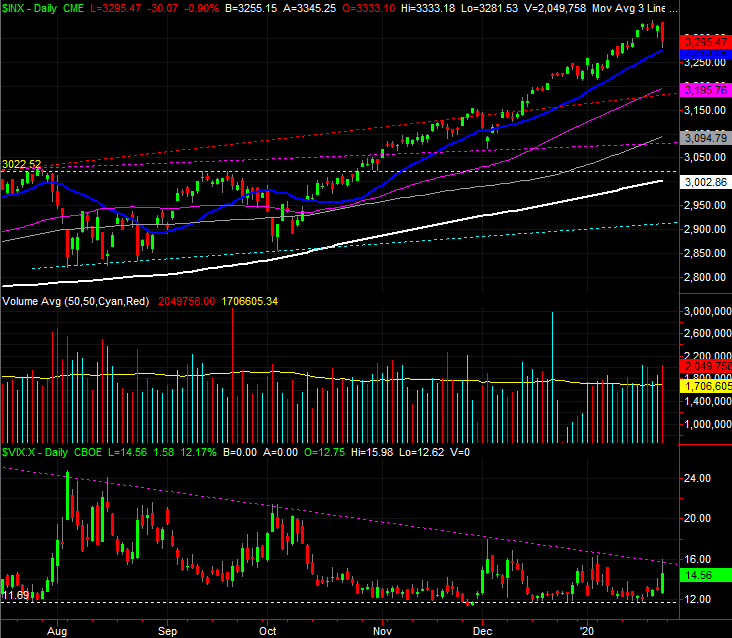
Friday's bar is the strongest clue yet that the pivot has been made. Specifically, it's the shape that's so concerning. It's an outside day reversal, meaning the opening was above Thursday's high, but the close was above Thursday's low. And, the intraday direction on Friday was in the opposite direction of Thursday's flow. This sweeping change of heart often indicates a reversal has begun, particularly when it takes shape after a prolonged rally.
S&P 500 Daily Chart, with VIX and Volume
Source: TradeStation
The reversal, however, isn't quite complete. There's one more item to cross off the checklist, so to speak, before the S&P 500 slips into more trouble than it can work its way out of. The VIX needs to push above the falling resistance line (purple) that's been steering it lower since August of last year. The VIX took a poke at that ceiling on Friday, but only brushed it without clearing it. In fact, as the weekly chart shows, the VIX's ceiling goes back to its peak from late 2018. The same weekly chart also paints a picture of how much out of character the past seventeen weeks have been.
S&P 500 Weekly Chart, with VIX and RSI

Source: TradeStation
Ditto for the NASDAQ and the VXN, by the way, although the NASDAQ's daily chart has cued up one key clue to the prospective pullback that the S&P 500's chart hasn't. That is, the composite has also formed a couple of different support lines (yellow) stemming from lows made since October, both of which happen to align with key moving average lines. The first of those floors is the 20-day moving average line (blue) at 9186, and the other one is the 50-day moving average line (purple) at 8869. Once the first one breaks -- if it breaks -- be concerned. If the second one breaks as well, be worried.
NASDAQ Composite Daily Chart, with VXN and Volume
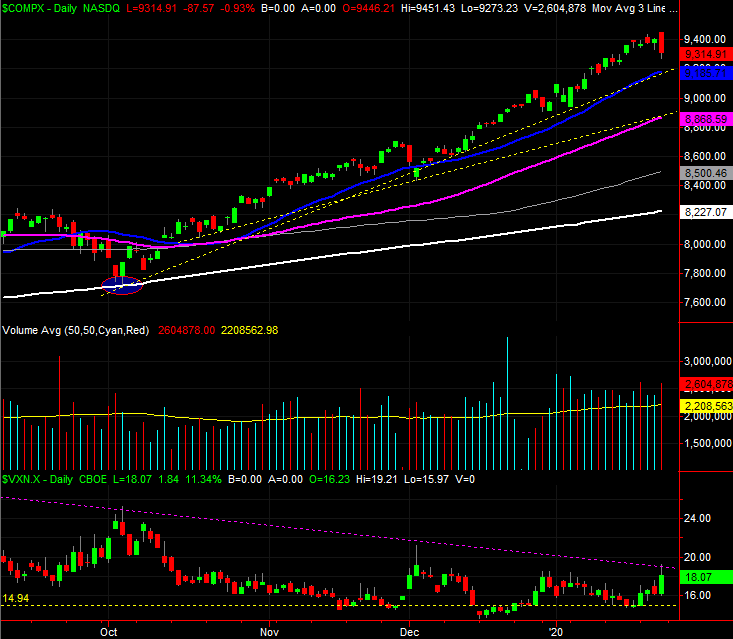
Source: TradeStation
Putting the slightly bearish spin on the matter is yet another clue that doesn't readily appear on any of the charts above. That is, the market's breadth (advancers and decliners) and depth (volume) is leaning in a bearish direction. It has been for a while, but turned decidedly so last week.
The chart below tells the tale, comparing the S&P 500 at the very top to the NYSE's bullish volume (UVOL), bearish volume (DVOL), daily advancers (ADV) and daily decliners (DECL). The daily data is too erratic to use, but when a moving average of each is overlaid on each data set, you can get a feel for the underlying trend. Even though the market's been rising since the very end of last year, up volume ad advancers have been deteriorating. Simultaneously, the NYSE's daily decliners and bearish volume have both been rising despite the S&P 500 itself continuing to drift higher.
S&P 500 vs. NYSE Up/Down Volume and Advancers/Decliners

Source: TradeStation
That's not to suggest the bulls won't shrug off the seemingly bearish breadth and depth data. They certainly did in December, after November saw a swell of decliners and bearish volume. All it took was that December 3rd stumble to hit the "reset" button to renew the rally. The market's up another 10% since then though, which makes the bulls less likely to step in again.
To that end, the trick for the bears will be pacing. Sudden plunges could be met with a new round of buying. A slow, smoldering pullback that accelerates on the way down is actually the more difficult train to stop.