The Dow as well as the S&P 500 were able to log gains last week, but they were far from convincing, the NASDAQ actually lost ground... the one index that needs to lead the way if the marketwide rally is to last. It was a win, but there's still reason to worry.
On the flipside, the good news is all the major indices remain above their most critical moving average lines. That means they have an edge in terms of remaining propped up while the bulls develop a strong foundation from which to launch the next lag of the advance (if that's what's in the cards).
We'll take a detailed look at the matter below. First, let's recap last week's big economic announcements and preview what's coming this week.
Economic Data Analysis
Last week was loaded with economic reports, beginning with Tuesday's look at consumer inflation for June. It was notably stronger than expected, suggesting stronger demand than a lack of supply. As of the latest look at the full-year/annualized number, the inflation rate stands at 1.2%, and 1.8% on a core basis. Both are much firmer than May's inflation lull, moving in the opposite direction
CPI Inflation Rate Charts

Source: Bureau of Labor Statistics, TradeStation
On Wednesday we got a biggie... perhaps the biggest report of the month. That's capacity utilization and industrial productivity for June. Both popped higher in June, suggesting the nation really was getting back to work. Both numbers were well up, and even better than economists were expecting.
Industrial Production and Capacity Utilization Charts
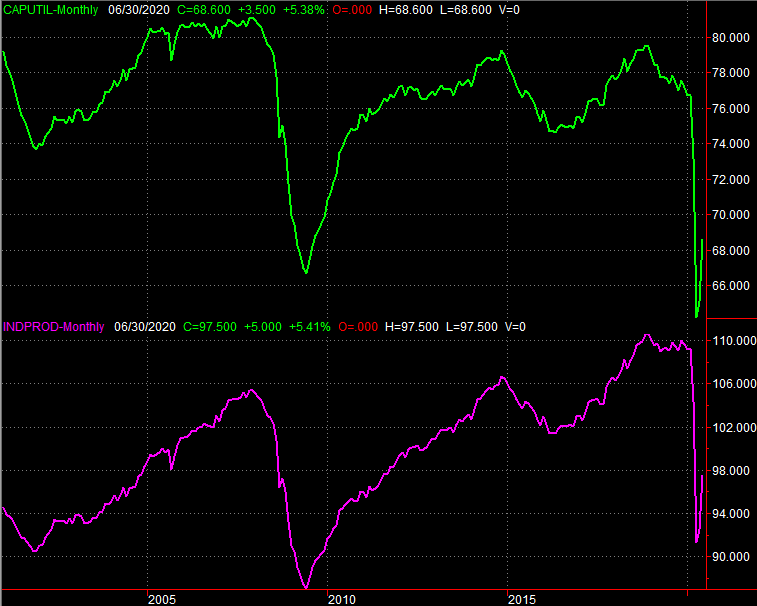
Source: Federal Reserve, TradeStation
It's a noteworthy report because, in general, industrial production and capacity utilization coincide closely with corporate earnings. Last month's solid report won't salvage second quarter's overall figures. But, they do suggest corporate profits will be able to recover quickly.
Retail sales figures for June add confirmation that the average consumer is doing well enough to create brisk demand. Overall retail consumption including car sales grew 7.5% last month, easily topping estimates for 5.2% growth. Stripping out automobiles from the calculation, however, still leaves you with 7.3% growth on a year over year basis.
Retail Sales Charts
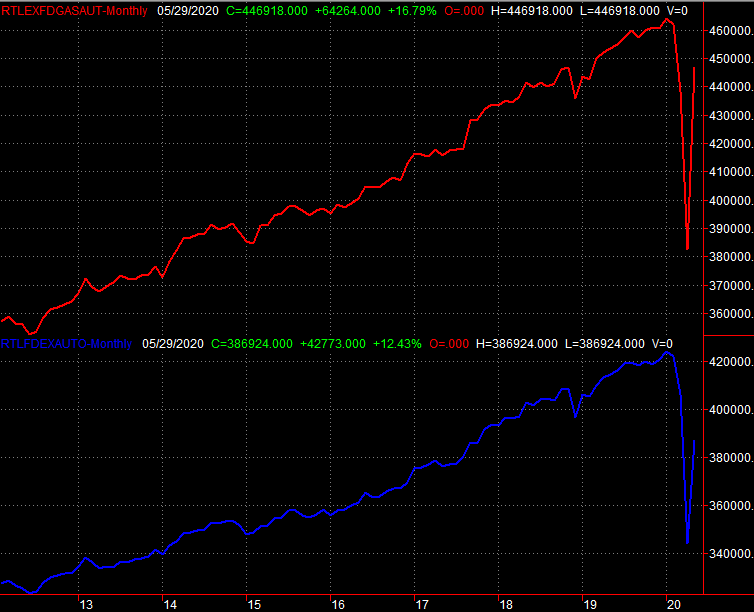
Source: Federal Reserve, TradeStation
Finally, even real estate activity is slowly getting back into the swing of things... even if that victory is simply the act of holding ground. Building permits ticked a little higher in June, to an annual pace of 1.241 million versus May's 1.216 million. Housing starts inched higher too, from 1.011 million units in May to 1.186 million for last month.
Housing Starts, Building Permits Charts
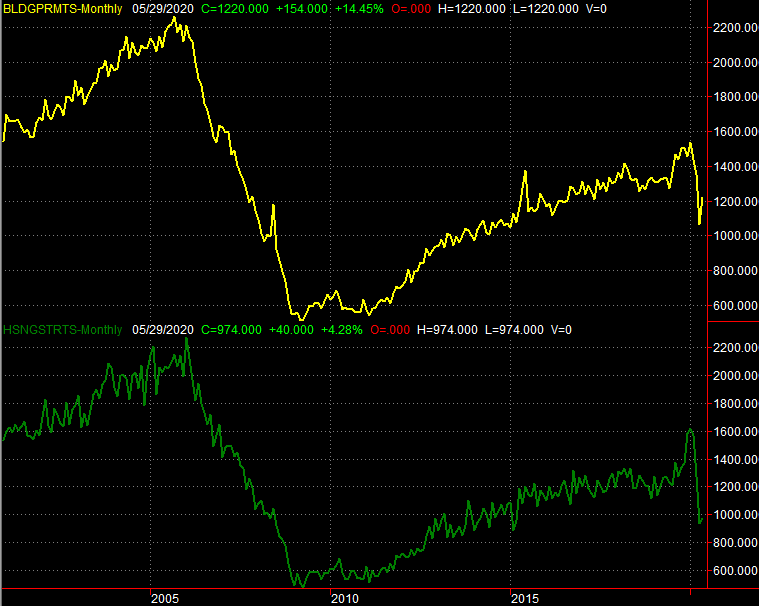
Source: Federal Reserve, TradeStation
Everything else is on the grid.
Economic Calendar

Source: Briefing.com
This week is going to be a light one in terms of economic news, letting traders ease into the thick of earnings season. We are getting a couple of related reports this week that will round out the look at the real estate market. Existing home sales for June will be released on Wednesday, followed by new home sales figures for June on Friday. Economists are looking for a solid uptick in sales of existing homes, but on the new homes front, the fallout from the coronavirus outbreak may have crimped availability of workers and materials. They shouldn't be much better than June's levels.
New Home Sales Charts
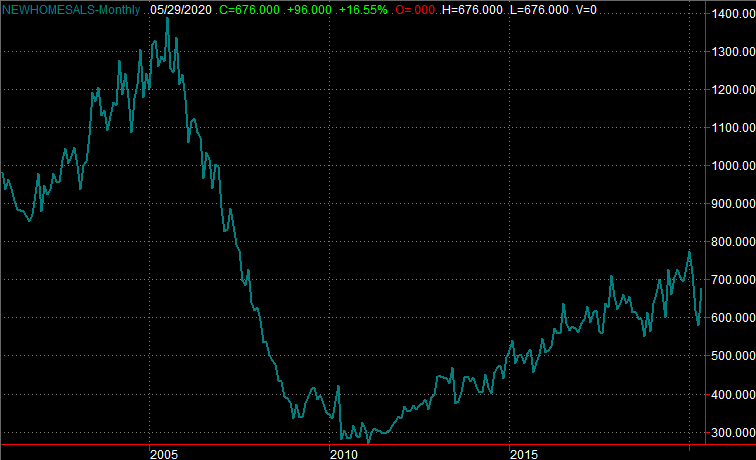
Source: Bureau of Labor Statistics, TradeStation
Stock Market Index Analysis
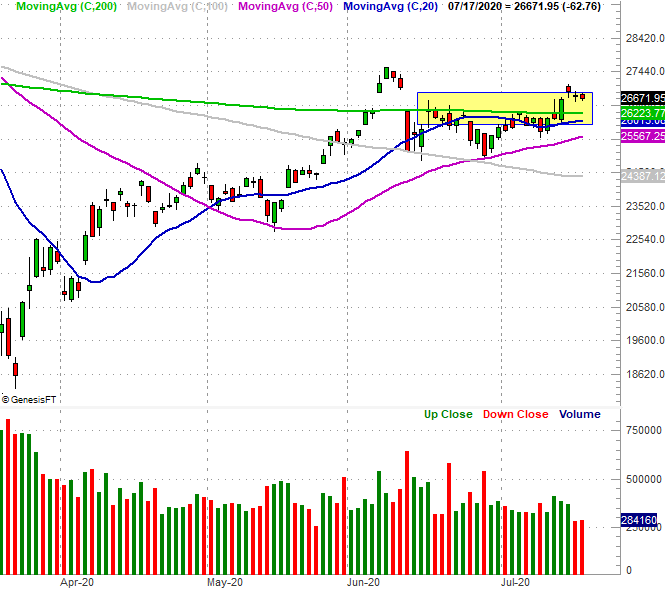
A week we lamented the fact that the Dow Jones Industrial Average couldn't get up and over its pivotal 200-day moving average line (green). We can lament no more. That happened on Tuesday of last week, when the market's surge lifted the Dow over that hump, using the 20-day moving average line (blue) as a pushoff point. The action following that gain was somewhat disappointing, but the biggest, most important job is done.
Dow Jones Industrial Average Daily Chart, with Volume
Source: TradeNavigator
Even more frustrating is that while the volume behind last week's wasn't awful, it wasn't great to begin with, and it waned the whole way up. Participation is key to a long-lasting rally, and we don't quite have it yet.
It's also true of the S&P 500. It had already cleared its 200-day moving average line in May, and also used its 20-day moving average line as a technical floor last week (and the week before). But, the volume's been poor.... perhaps a sign of the season, or just perhaps a lack of conviction. We don't know. We do know, however, that while the S&P 500 logged a 1.2% gain last week, it was suspiciously unable to move past the peak of 3238.0 hit it early June. Traders may have unwittingly drawn a mental line in the sand.
S&P 500 Daily Chart, with VIX and Volume
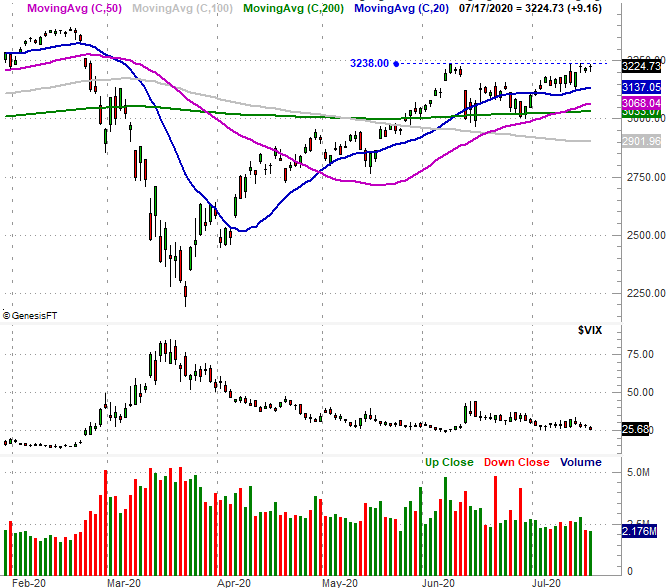
Source: TradeNavigator
Most concerning, however, is the fact that the NASDAQ Composite didn't log the same big gain that other indices did on Tuesday, despite the fact that its oversized drubbing on Monday gave it the best opportunity to do so.
Take a look. Yes, the composite is still within a well-established support and resistance zone framed by orange lines. The 20-day moving average line (blue) is also serving as support. As long as one or the other remains underneath the NASDAQ, the rally is still technically alive. On the other hand, like the Dow and the S&P 500, the bullish volume keeping the NASDAQ Composite propped up of late continues to thin.
NASDAQ Composite Daily Chart, with Up and Down Volume
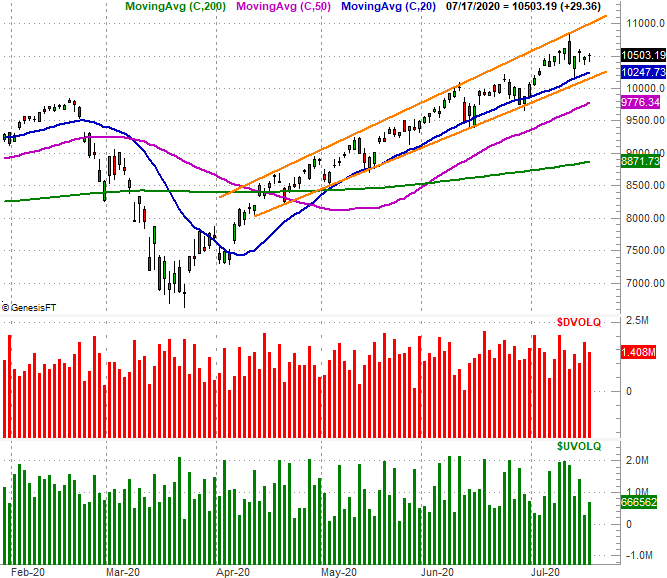
Source: TradeNavigator
There's an important nuance buried in the superficial look at all three of these indices. That is, the blue-chip-heavy Dow is starting to do very well, while the tech-heavy (and growth-heavy) NASDAQ Composite is starting to lag; the S&P 500 remains somewhere in between. It's noteworthy simply because the NASDAQ tends to lead the market, up or down. The fact that it's been lagging of late suggests the overall market may be readying for a pullback.
That's just a thought anyway. Again, all three of the major indices remains above their most critical moving average lines. Those are the 20-day and 200-day moving averages. Until those floors break, the market remains in the hunt for higher highs.
Still though, with the NASDAQ now 22% above its 200-day moving average line, it's at a rarely-seen and even less-frequently-maintained extreme.