Weekly Market Outlook - Another Week, Another Win... Maybe Too Much of a Win

Another weak, another win, with the all the right people able to put the right spin on the right headlines. While several companies came up short on the earnings front and others warned of headwinds, traders were led to see the glass as half-full rather than half-empty.
It's still too soon to say June's low was the market's ultimate low, making the current rally one to plug into for the long haul. It would be wiser to see how it responds to a real test. As it stands right now though, the bulls have the edge.
We'll look at the matter in detail below. First, however, let's run down last week's major economic announcements and preview what's coming this week. It should be raucous to say the least, ending with a look at July's jobs numbers.
Economic Data Analysis
In a nutshell, consumer confidence is lousy right now. The Conference Board's sentiment measure fell to a multi-month low of 95.7 in July, extending a pullback that's been underway since early last year. The University of Michigan Sentiment Index ticked a little higher from June's final reading, but June's reading as a multi-year low. Folks are getting spooked, which tends to stifle consumer spending.
Consumer Sentiment Charts

Source: Conference Board, University of Michigan, TradeStation
Curiously, home prices continued to rise through May even though the real estate market's been bumping into a headwind since then. Both the FHFA Housing Price Index as well as the Case-Shiller Index continued to move into record-high territory per their most recent updates.
Home Price Charts
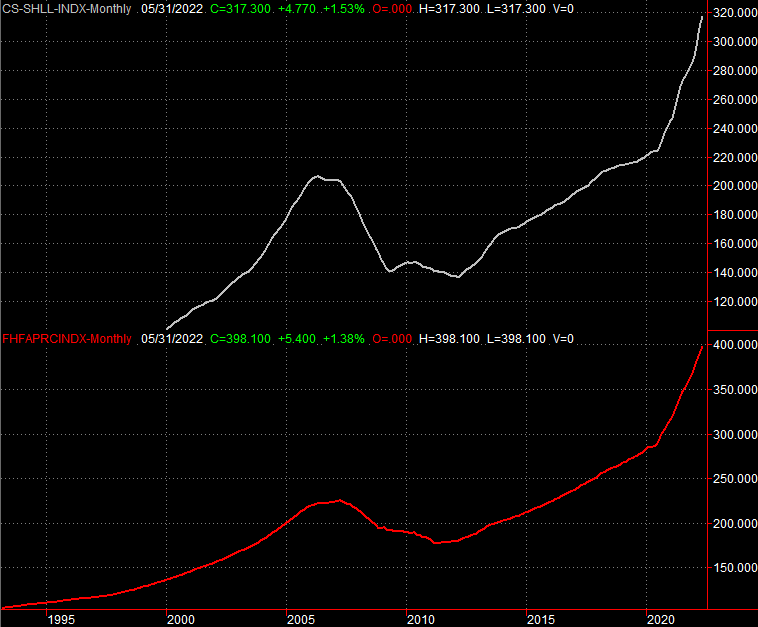
Source: FHFA, Standard & Poor's, Case-Shiller, TradeStation
Just bear in mind this data only considers the average price of a home that's been transacted; total unit sales don't factor into it. It's arguable that only the high-end market is holding up, but it eventually follows the middle and low-end sliver of housing. In this vein...
Sales of new homes plummeted -- again -- in June, to an annualized pace of 590,000 units. That's the lowest reading since things came to a screeching halt in early 2020 due to the pandemic, and as a reminder, sales of existing homes are just as poor now.
New and Existing Home Sales Charts
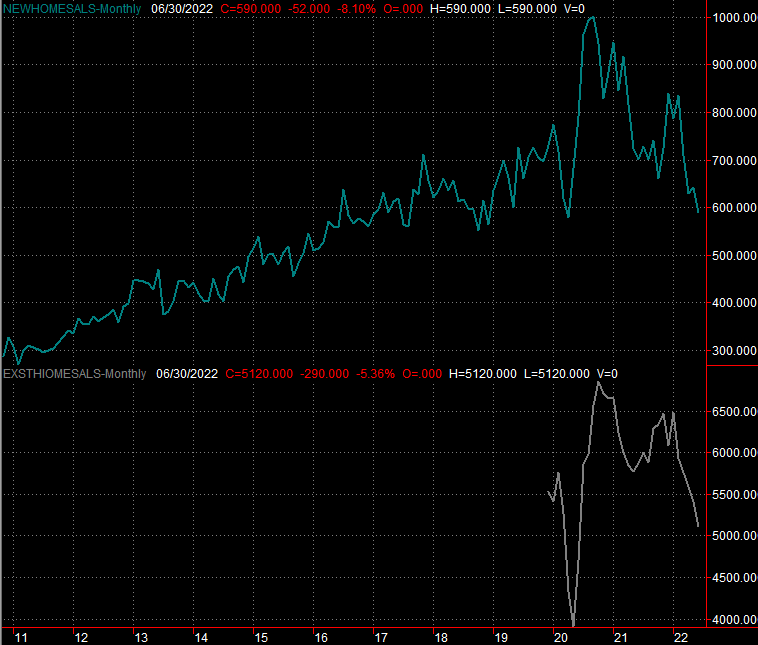
Source: Census Bureau, National Association of Realtors, TradeStation
Although they're the only ones we're charting, these aren't the only economic red flags that started to wave in earnest last week. We also learned that Q2's GDP contracted for a second consecutive quarter, this time by 0.9%. And, though it tends to cool economic growth, the Federal Reserve felt compelled to raise the Fed Funds Rate by 75 basis points in an effort to curb still-rampant inflation.
Everything else is on the grid.
Economic Calendar
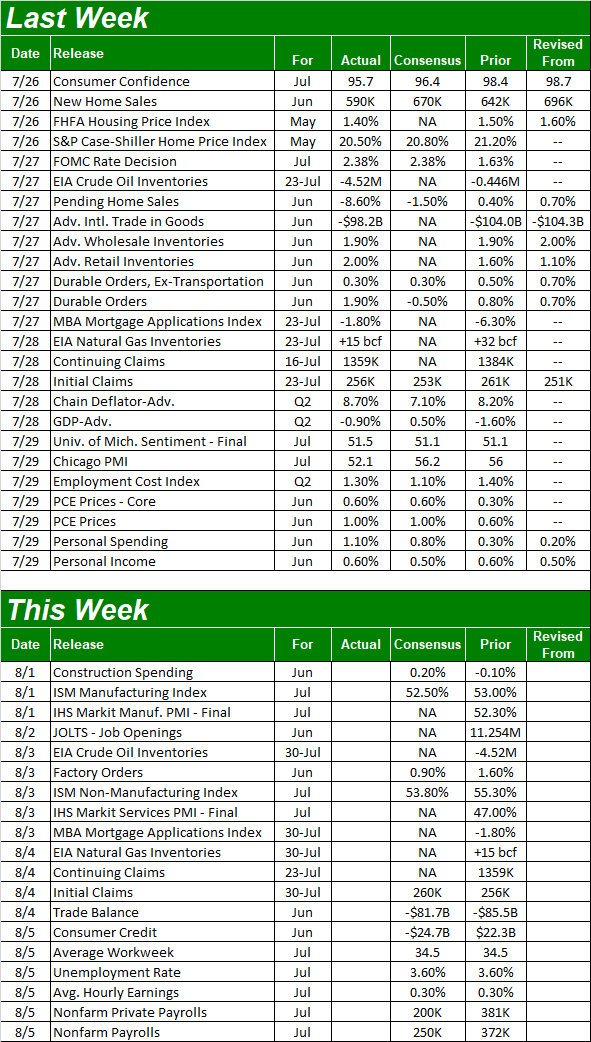
Source: Briefing.com
This week won't be quite as busy, but we're getting a couple of big ones.
On Monday and Wednesday, respectively, we'll hear the Institute of Supply Management's updated manufacturing and services index figures, respectively. Although both are expected to hold above their critical 50 levels, both are also likely to pull back just a bit from June's readings, extending downtrends that have been in place since the middle of last year.
ISM Manufacturing and Services Index Charts
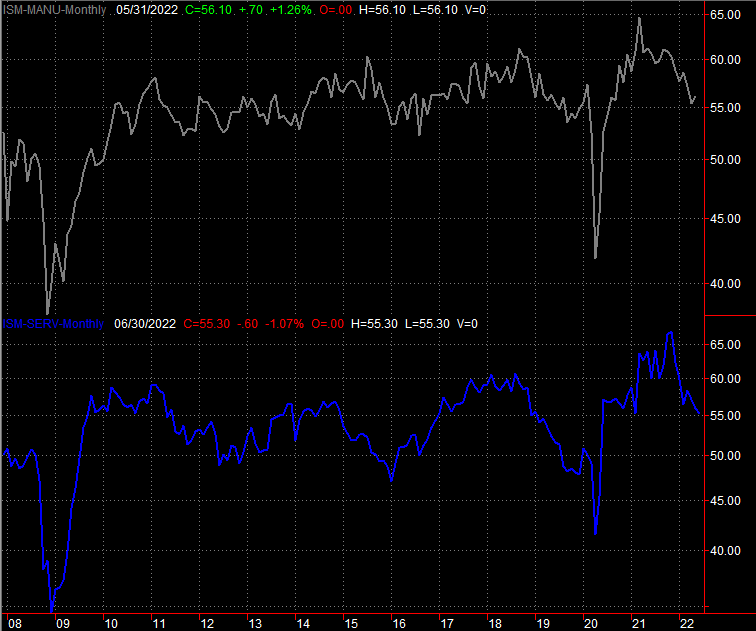
Source: Institute of Supply Management, TradeStation
The week's big Kahuna, however, is Friday's jobs report. The Department of Labor is expected to report the creation of 250,000 new jobs, marking a slowdown from June's figure of 372,000. But, that won't likely be enough to dial back the unemployment rate from its current -- and healthy -- reading of 3.6%.
Payroll Growth and Unemployment Rate Charts

Source: Department of Labor, TradeStation
Stock Market Index Analysis
This week's analysis begins with a look at the weekly chart of the S&P 500, as this is where the power of the recent bullishness becomes most evident. Two weeks ago the index punched through a technical ceiling at 3910, and last week's 4.2% advance put some more distance between the index and June's low. It also carried the S&P 500 just a hair past the 100-day moving average line (gray) at 4122. Perhaps most noteworthy is the fact that the volatility index (or VIX), broke under its rising support line (orange) that had been guiding it higher since early this year.
S&P 500 Weekly Chart, with VIX and Volume
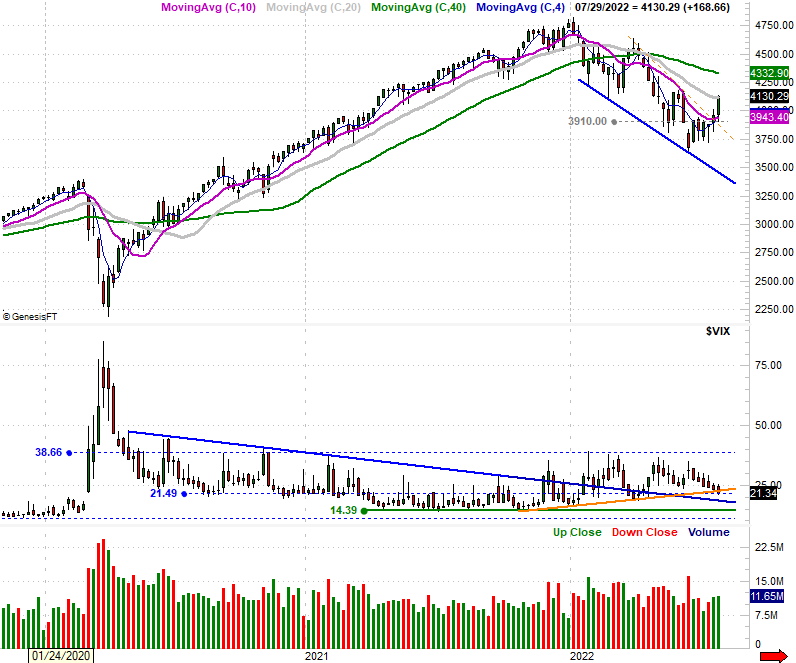
Source: TradeNavigator
Here's a look at the daily chart, for a little more detail. Notice on this image that the volume was growing on the way up during the latter half of last week, underscoring the momentum. This level of participation has been the missing link with all of the previous rebound efforts.
S&P 500 Daily Chart, with VIX and Volume
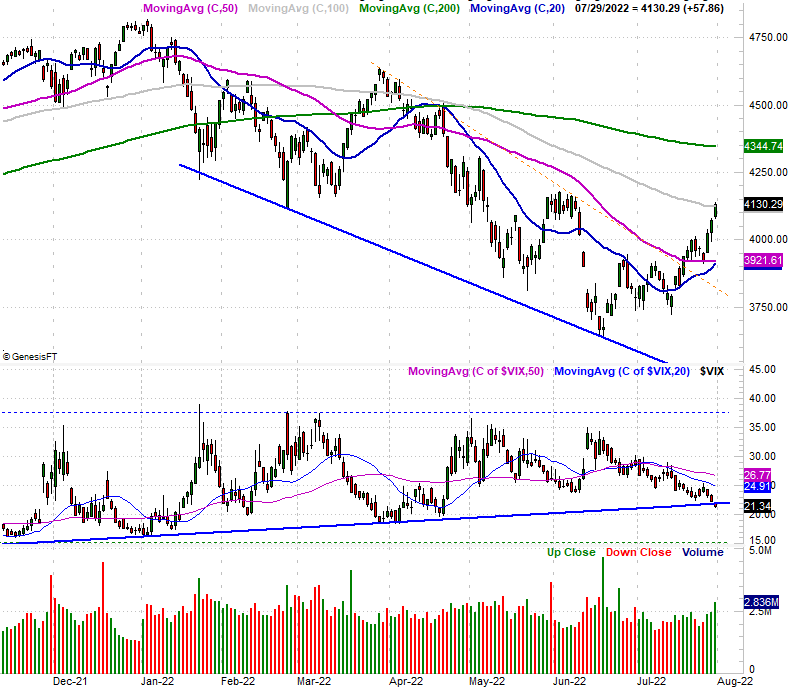
Source: TradeNavigator
The NASDAQ Composite broke through some technical ceilings of its own... the same ceilings, actually. The resistance at 11,630 that was holding it back just three weeks ago is well in the rearview mirror, with last week's 4.7% gain carrying it above the 100-day moving average line (gray) at 12,309. And, the NASDAQ's volatility index (VXN) also broke under it's intermediate-term support line (green, dashed). Like the S&P 500, this all indicates a major paradigm shift towards bullishness.
NASDAQ Composite Daily Chart, with VXN
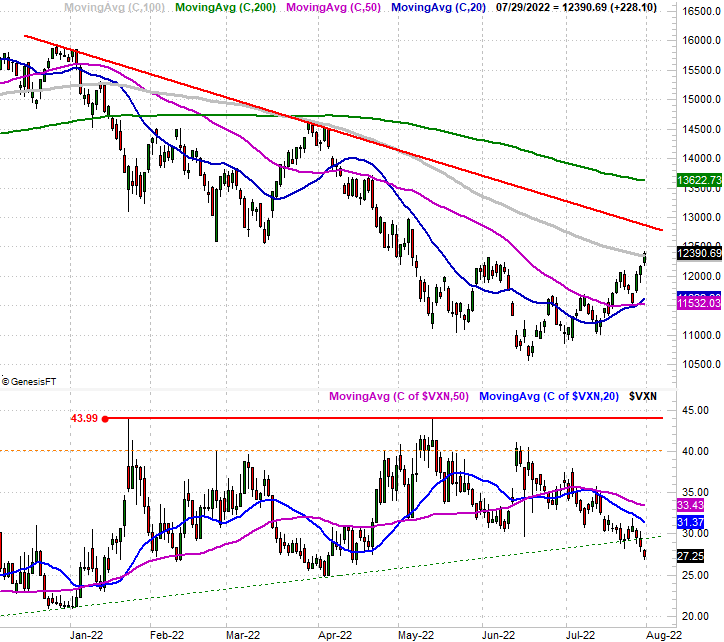
Source: TradeNavigator
Here's the weekly chart of the NASDAQ, for a little more bigger-picture perspective. As is made even clearer here, things have take a serious turn for the better again, even if the composite has yet to test a major resistance level (orange) currently at 12,800.
NASDAQ Composite Weekly Chart, with VXN
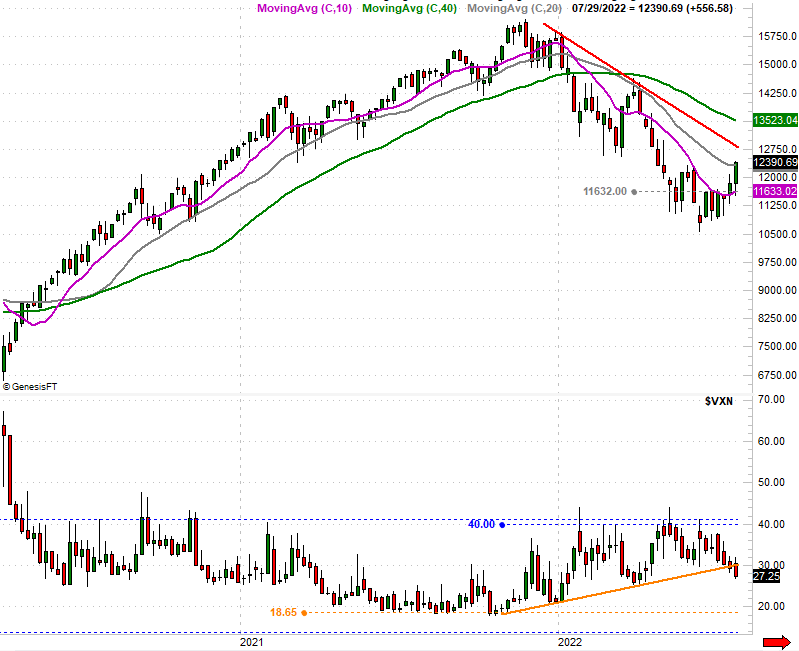
Source: TradeNavigator
This turn for the better, in fact, might be a little bit too good for the market's health. The S&P 500 has advanced 7% in just two weeks, and a hefty 12% in just the past six weeks. Granted, that big jump followed a similarly-big selloff. It's a lot of ground to cover in a short period of time all the same, however, inviting profit-taking. To this end, bear in mind that most of the big selloffs made this year have taken shape right when it looked like the market was finally shrugging off its weakness. A few more of the wrong kind of earnings report or poor jobs numbers could still easily pull the rug out from underneath the effort.
Whatever awaits, this isn't a time to step into new long positions. Let's wait and see what happens when the bulls are really tested here.
The S&P 500's floor to watch now sits at 3920, where its 20-day (blue) and 50-day (purple) moving averages are about to converge.