Weekly Market Outlook - Another Week, Another Record. Can It Last?
With a little extra help from Apple (AAPL), stocks finished an otherwise-choppy week with a strong Friday push to record highs. More telling is how for the first time in a long time, we're starting to see some real volume behind the bullish advance, suggesting it's got the help of the undertow.
 On the flipside, we're back to a potential "too good for our own good" scenario, as marked by a VIX that's back to an absolute low level. This implies traders' bullish mindset is maxed out. It's also worth noting that while volume is growing and the market is rising, it's not bullish volume that's growing; most of the volume is for stocks that are falling. Perhaps the rally isn't quite as healthy as it seems.
We'll look at what's right and wrong with the market below, as always, after a run-down of last week's economic news... including a look at some deceptively-compelling jobs figures for October.
Economic Data
Though it was the last major piece of economic news we heard last week, it was easily the most important and most watched item. We're talking about last month's employment report, so let's just start this week's recap there -- October's unemployment rate fell to a multi-year record low of 4.1%, and we added 261,000 new jobs.
Payroll Growth and Unemployment Rate Charts
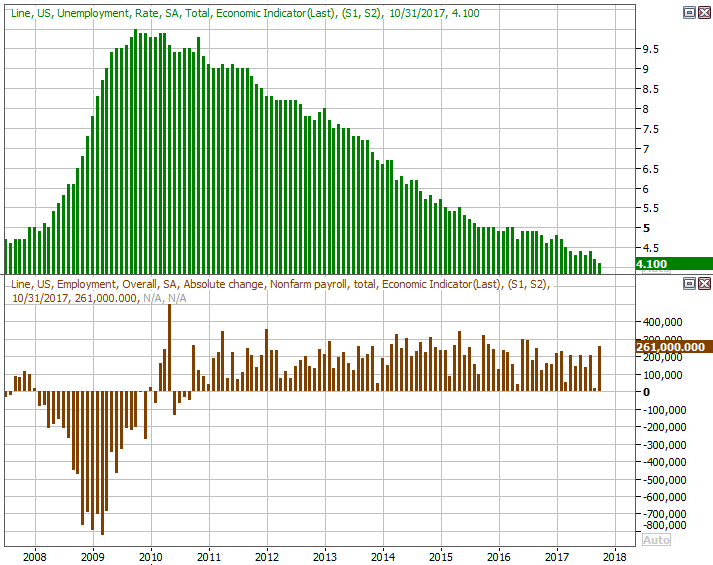
Source: Thomson Reuters Eikon
It seems like a big victory, and in some regards it is. There are key footnotes for both data points, however, that take some of the shine off the report. Namely, the September hurricanes that ravaged the southeast skewed that month's data lower, and set the stage for a snapback that exaggerated last month's reversal. Moreover, the job volatility stemming from Harvey and Irma has yet to fully dissipate. It could be a few more months before we get a bead on the true trend here.
To the extent one can draw conclusions from the data, though, we did so at the website with a much more robust examination of ALL of October's employment numbers.
We also got a double-dose of ISM data, with the services index report coming on Friday, following the manufacturing side of the report posted on Wednesday. The former rose, the latter fell, and both remain well above the key 50 level.
ISM Index Charts
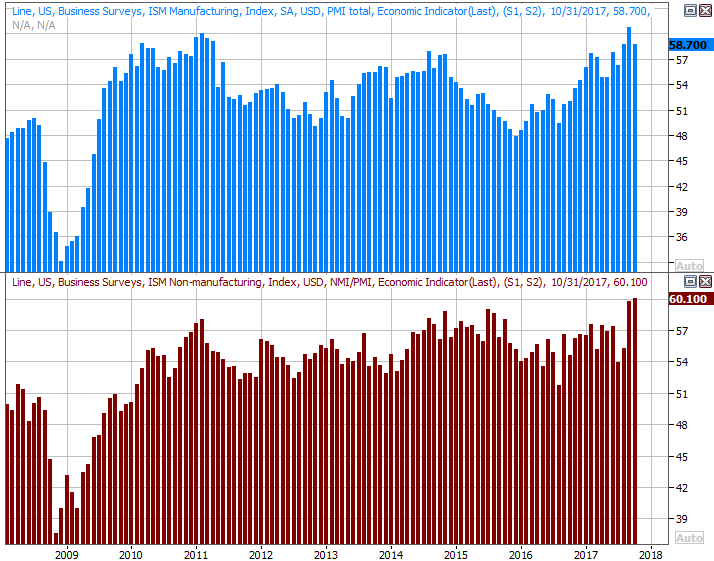
Source: Thomson Reuters Eikon
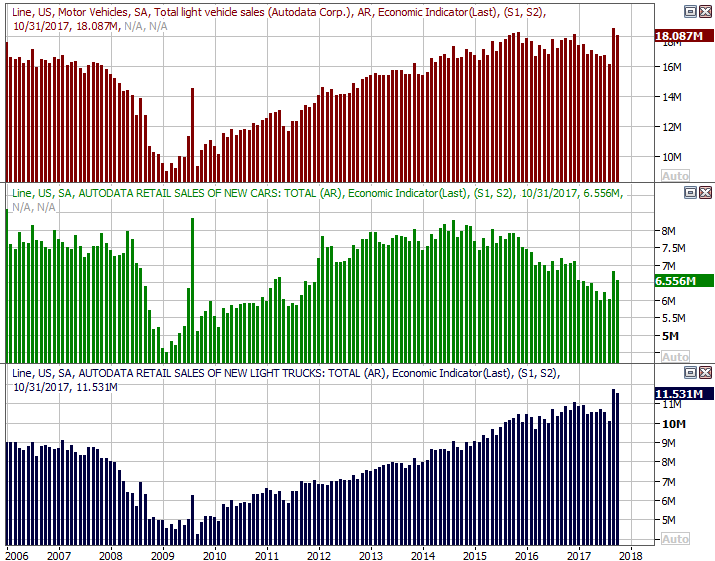
Auto sales were relatively solid last month, but like the jobs report, you have to take the data with a grain of salt -- the pair of hurricanes that ripped through the southeast in September has already prompted the purchase of replacement vehicles for some, while other victims have yet to even worry about a lost or destroyed car. To the extent it's telling though, auto sales
Auto Sales Charts
Source: Thomson Reuters Eikon
Finally, though there's no chart for it, notice last month's personal spending and income were both up quite a bit. The Department of Labor's report from Friday didn't confirm it with a similar improvement, but broadly speaking we've seen things moving in this direction -- healthier consumption and incomes -- for a while.
Everything else is on the grid.
Economic Calendar
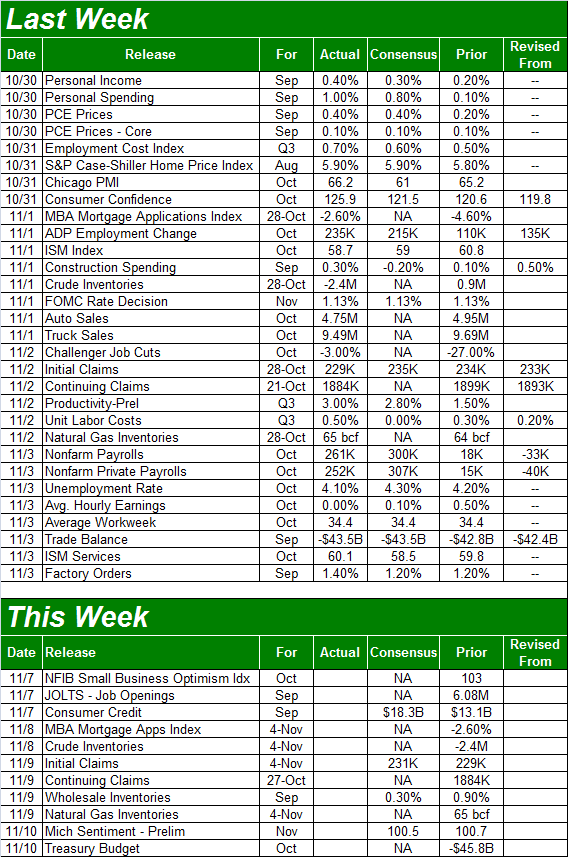
Source: Briefing.com
This week isn't going to be nearly as busy as last week was. In fact, the only items of real interest are going to be inventory levels of crude oil, and natural gas inventory readings. They're a key component of oil and natural gas prices.
Prior to the hurricanes (and Harvey in particular), oil stockpiles were falling in earnest. The shutdown of many refineries pushed stored-oil levels higher for a while, but now that things are starting to look back to normal, inventory levels are starting to be whittled away again.
Crude Oil, Natural Gas Stockpile Charts
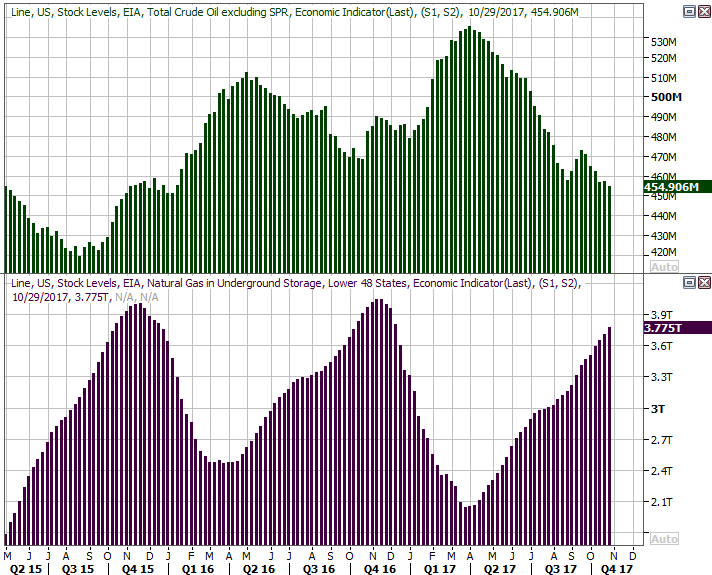
Source: Thomson Reuters Eikon
That's clearly not the case for natural gas inventories, with storage ramping up heading into the cold winter months. Even so, natural gas levels for this time of year are still behind 2016's and 2015's buildup.
Index Analysis
The bears had plenty of opportunity to kill the bullish undertow last week. They just didn't. The buyers kept on buying, shrugging off the headwinds to end the week at a record high close.
S&P 500 Daily Chart

Source: TradeNavigator
It was anything but a perfect, rock-solid advance, however.
We mentioned above the volume we've seen of late hasn't been decidedly bullish. That wasn't a gut feeling. The graphic below illustrates the reality. The number of advancers on the NYSE continues to drift lower, and the NYSE's bullish volume is pointed in a downward direction as well. Conversely, the NYSE's decliners and bearish volume are both still edging higher.
NYSE Advancers, Decliners, Up and Down Volume
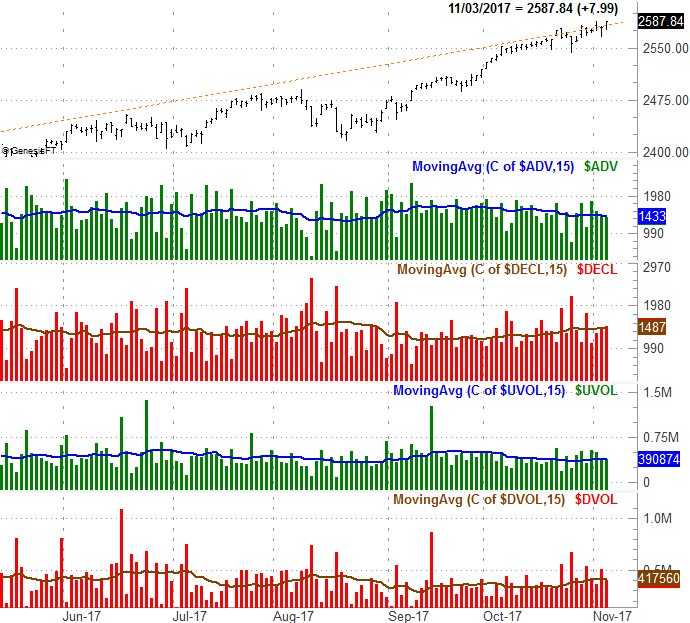
Source: TradeNavigator
You'll also see on the daily chart of the S&P 500 above the VIX plunged to a (more or less) absolute low around 9 on Friday, leaving little to no room for stocks to keep pushing higher.... at least in terms of sentiment.
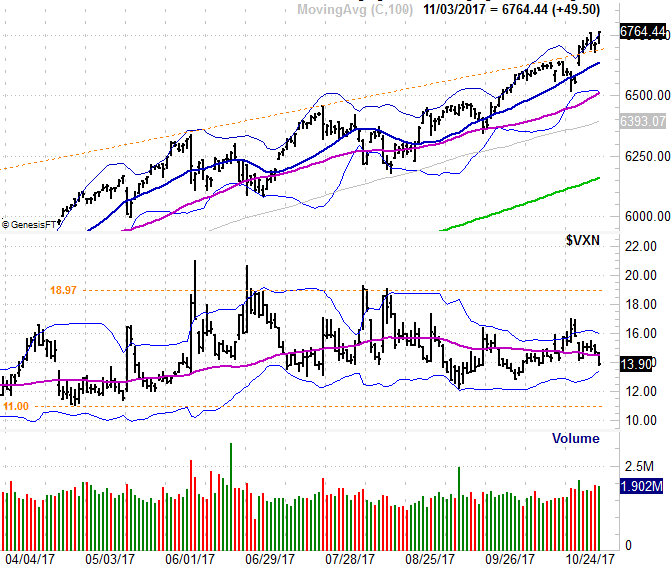
The daily chart of the NASDAQ Composite looks about the same as the S&P 500's chart does. That is, though overbought and ripe for a profit-taking pullback, the bulls just wouldn't let go. Unlike the S&P 500's volatility index, however, the VXN isn't at its major floor (around 11.0).
NASDAQ Composite Daily Chart
Source: TradeNavigator
Zooming out to the weekly chart of the S&P 500 doesn't actually tell us anything new about the market's condition and foreseeable future. It does offer us some helpful perspective on where we've come from though, and what it's going to take to bring an end to this long-term rally effort. From this vantage point, we can see just how unusual the advance since last November has been, and how ripe we are for some selling. The S&P 500 is now 6.4% above its 200-day moving average line (green), which is its historical maximum average separation from the long-term indicator.
S&P 500 Weekly Chart
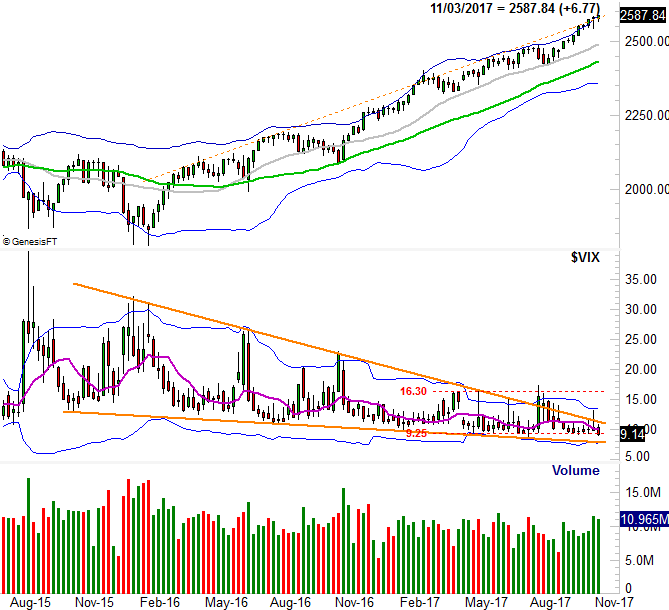
Source: TradeNavigator
It's also on this chart we can see that the VIX is near an almost-formed tip of a converging wedge shape that won't give it any more room to maneuver. On the other hand, until we actually get to a point where the VIX gets squeezed out, a lot can happen. Moreover, until the VIX's 16.30 ceiling is broken and the S&P 500 breaks under the 100-day moving average line (gray) fails as a floor, we can't read too much into.... anything. Indeed, the trend is still technically bullish until further notice. That will be the case at least until the index falls under the 50-day moving average line (purple) at 2520.