Weekly Market Outlook - Another Record High, But Not The Ideal One
In a sweeping reversal of the previous week's weakness, stocks marched to record highs last week on the heels of a 4.6% rally from the S&P 500. Is the advance now out of gas? Maybe.
There are new barriers the rally will have to contend with this week, however. Most of the indices are now once again bumping into technical resistance that was first established months ago, and the broad market is just plain overbought. The volatility indices are also back to recent absolute floors, suggesting traders have reached their peak potential optimism.
We'll dissect those details below. First though, let's look at last week's economic reports and preview which economic announcements are on this week's dance card.
Economic Data Analysis
Last week's big news was of course the jobs report for January. The Department of Labor reported the creation of 49,000 (net) new jobs last month, slightly reversing December's revised loss of 227,000. But, that was still enough to drive the unemployment rate down from 6.7% to 6.3%. Don't get too excited just yet though. The calculated size of the population as well as the size of the labor pool both fell somewhat dramatically, exaggerating the benefit of relatively small progress. We are making progress on the jobs front, but not as much as January's numbers might imply.
Unemployment Rate and Payroll Growth Charts

Source: Conference Board, University of Michigan, TradeStation
The only other big news from last week as the look at last month's ISM data... the services as well as the manufacturing index. Manufacturing fell a bit, from 60.5 to 58.7, while services edged up from 57.7 to 58.7. Both are still plenty strong though, well above the 50 level that divides growth and contraction.
ISM Index Charts
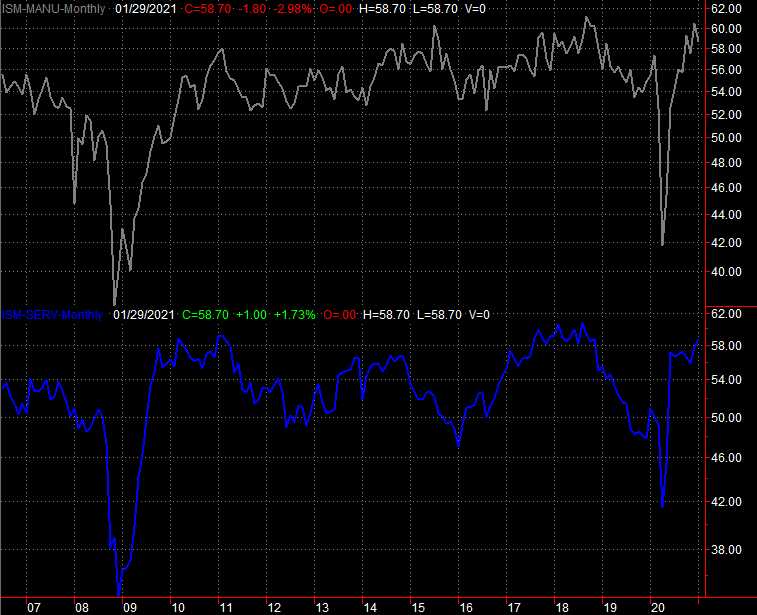
Source: Conference Board, University of Michigan, TradeStation
Everything else is on the grid.
Economic Report Calendar

Source: Briefing.com
This week is going to be easier to work through in terms of economic news to think about. In fact, we're only getting one item of interest, and only a little bit of it at that. On Wednesday look for last week's consumer inflation update. Economists aren't looking for much, but they are looking for some. Prices on core goods (ex-energy and ex-food) likely only increased 0.1% last month, although overall prices including food and energy probably grew 0.4% in January. As it stands right now, the overall annualized consumer inflation rate stands at 1.36%, which is completely palatable. Last month's expected price increases shouldn't change that annual pace much at all.
Consumer and Producer Inflation Charts
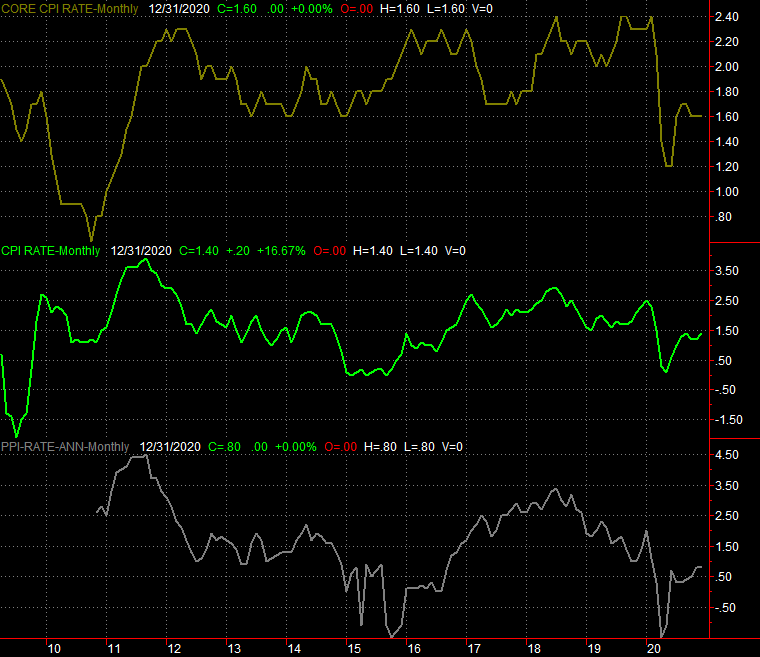
Source: Bureau of Labor Statistics, TradeStation
We'll hear about January's producer inflation levels next week. They've remained in-line with consumer inflation in recent months, and that should be the case this time around too. More importantly, tame inflation indicates a certain level of stability with the economy, not forcing the FOMC to make any sweeping moves that ultimately prove more disruptive than helpful.
Stock Market Index Analysis
In a complete reversal of the prior week's drubbing, stocks rallied in a big way last week. It shouldn't come as a complete surprise. Even as ugly as things were two weeks ago, the S&P 500 only tested its 50-day moving average line (purple) as a floor without breaking under it. That same line appeared to be a pushoff point on Monday, driving the index to its record highs hit on Friday. That pushoff is highlighted in yellow... pretty well scripted.
S&P 500 Daily Chart, with VIX and Volume
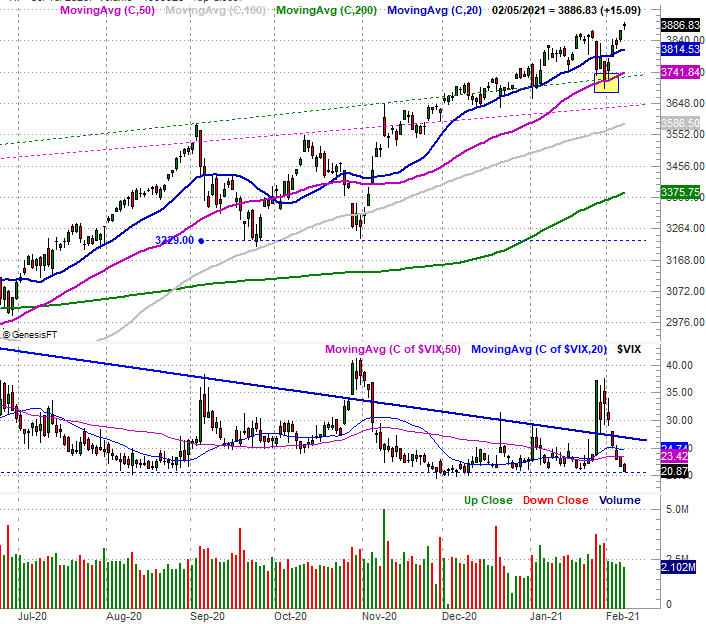
Source: TradeNavigator
That technical reversal is the least-interesting aspect of the S&P 500's daily chart, however. Far more curious is the sharp sinking of the S&P 500Volatility Index -- or the VIX -- also called the market's fear gauge. Not only is it back to a recent absolute floor near 21.0, but it got there in a hurry... too fast, in fact. This sudden swell of optimism has taken confidence to levels that often coincides with market peaks. Yes, there was no peak when the VIX got that low in late-November. That's the exception to the norm though.
The other curiosity? The volume behind the advance was never great, but waned all the way up.
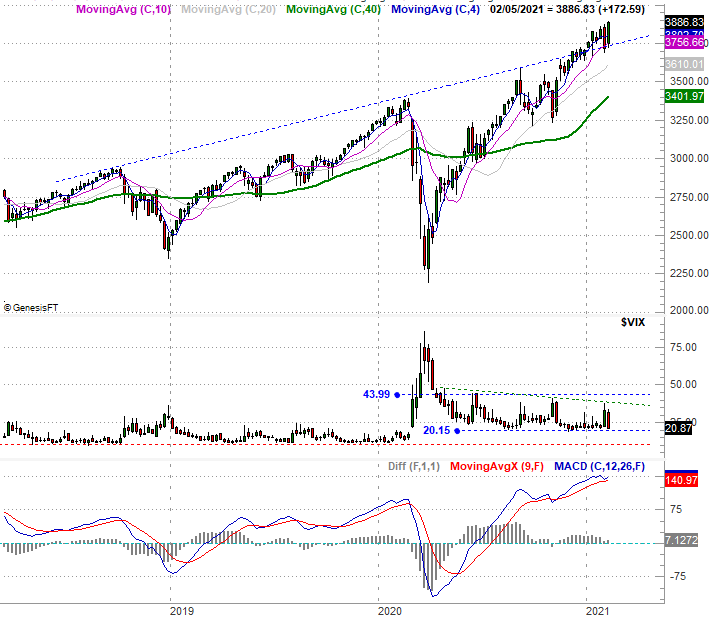
Here's the weekly chart of the S&P 500, just for some more perspective. There's lots to soak in here, like the sheer scope of the reversal from the previous week's similarly big moves (in the opposite direction). It's also in this timeframe we can see why the VIX's 21.0 level is a concern. More than anything, notice how far the S&P 500 has come since March's low. Even factoring out last year's plunge and subsequent recovery, the index is a little bit ahead of itself.
S&P 500 Weekly Chart, with VIX and MACD
Source: TradeNavigator
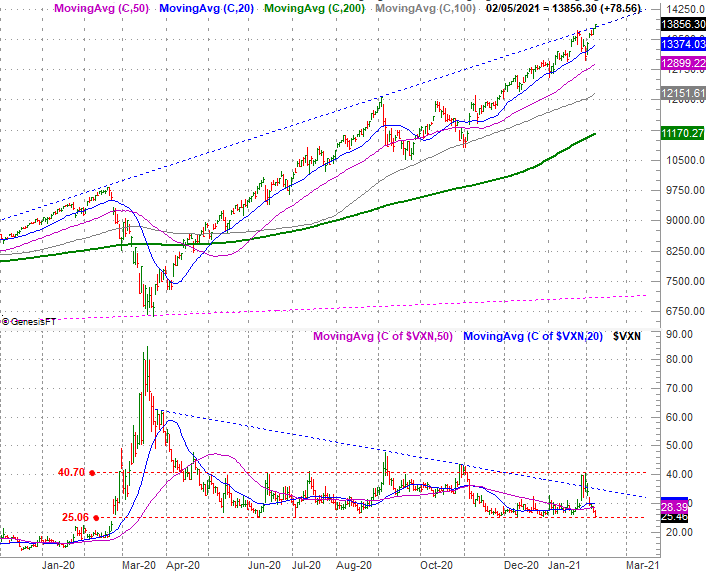
Same story for the NASDAQ Composite, more or less. It didn't have to make contact with its 50-day moving average line last week. Rather, it used its 20-day moving average line (blue) as the reversal launchpad last week. Like the S&P 500, however, the NASDAQ's volatility index -- the VXN -- is back to its absolute support at 25.0.
NASDAQ Daily Chart, with VXN
Source: TradeNavigator
This is tricky. The bulls easily renewed their momentum last week, and bullishness continues to flame more bullishness. Earnings and headlines are helping. The gains are now well beyond historical norms, however. The S&P 500 has rallied more than 70% from March's lows, and now lies 14% above its 200-day moving average line (green). Something's got to give sooner or later, and probably sooner than later.
The unusually-low volatility indices also set the stage for a "peaky" market. Be prepared for that. Until the S&P 500 breaks under its 50-day moving average line, the rally remains intact. For the NASDAQ, the line in the sand is the 100-day moving average line (gray), currently at 12,152. In the same vein, both the VIX and the VXN still have clear technical ceilings that need to be broken before the market itself is.
NASDAQ and S&P 500 Volatility Indices
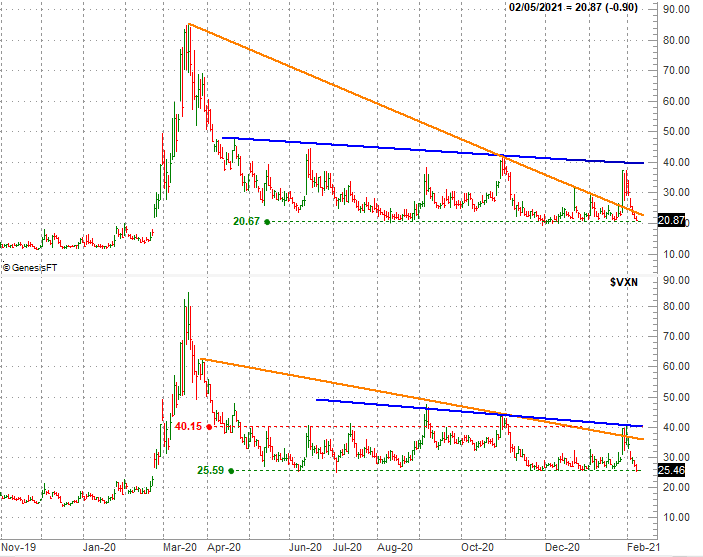
Source: TradeNavigator
The smart thing to do here may be doing nothing... nothing other than waiting to see how this all shakes out. The good news is, the lines in the sand are quite clear.