Weekly Market Outlook - Another Good (But Far From Perfect) Week for Stocks
The most bullish week in months is a tough act to follow. So, all things considered, even with last week's slowdown the market did pretty well for itself. The S&P 500 climbed 1.8% last week, cutting further into its selloff suffered earlier this year.
As far as bullishness goes though, this undertow is still less than ideal. The volume behind the effort remains subpar, and most of the indices remain on the wrong side of some key moving averages. More than anything though, it's clear that the market's bullish momentum was mostly waning each and every day of last week, even with Friday's strong close. That's particularly true of the NASDAQ.
We'll look at that slowdown in some detail below. First though, let's look at last week's major economic news and preview what's coming this week.
Economic Data Analysis
It wasn't a terribly busy week last week, but we did get a couple of noteworthy items.
One of those items was last month's new home sales. As feared, they fell quite a bit, from January's pace of 788,000 to 772,000. The dip mirrors February's stumble of sales of existing homes.
New and Existing Home Sales Charts
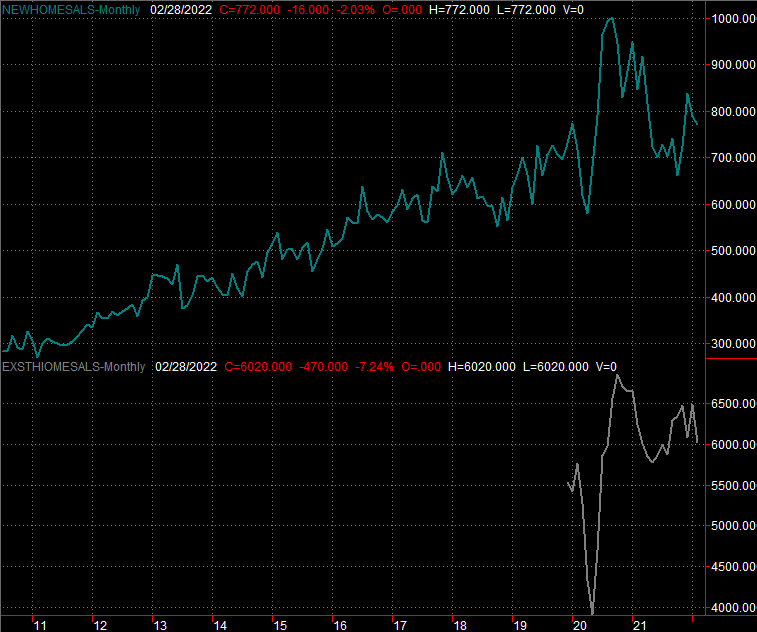
Source: U.S. Census Bureau, National Association of Realtors, TradeStation
Not shown on our chart above is that pending home sales for February slipped 4.1%, down from February's tumble of 5.8%. That's the fourth month in a row this metric has dropped, and we're nearing a two-year low. It's not a stretch to suggest the housing market is nearing a turning point, as we run out of buyers, houses become unaffordable, and mortgage rates start to rise... all at the same time.
The other big item from last week was the third and final look at the University of Michigan Sentiment Index. Unsurprisingly, it too came in lower than February's readings, falling from 62.8 to 59.4. That's deep into multi-year low territory.
Consumer Sentiment Charts
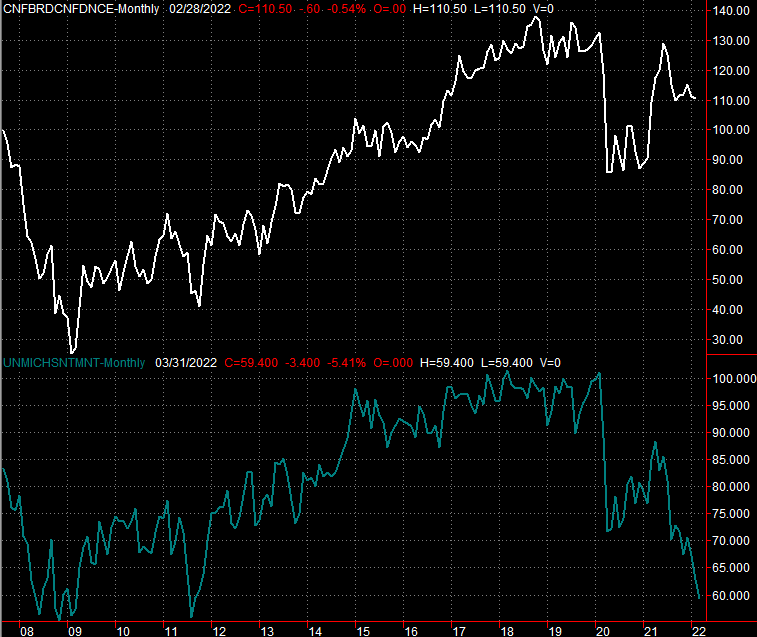
Source: Conference Board, University of Michigan, TradeStation
The Conference Board's consumer confidence score for March is coming this month. As you can see, though not as dramatically, it's in a pretty persistent pullback as well. Economists expect yet-another tumble.
Everything else is on the grid.
Economic Calendar
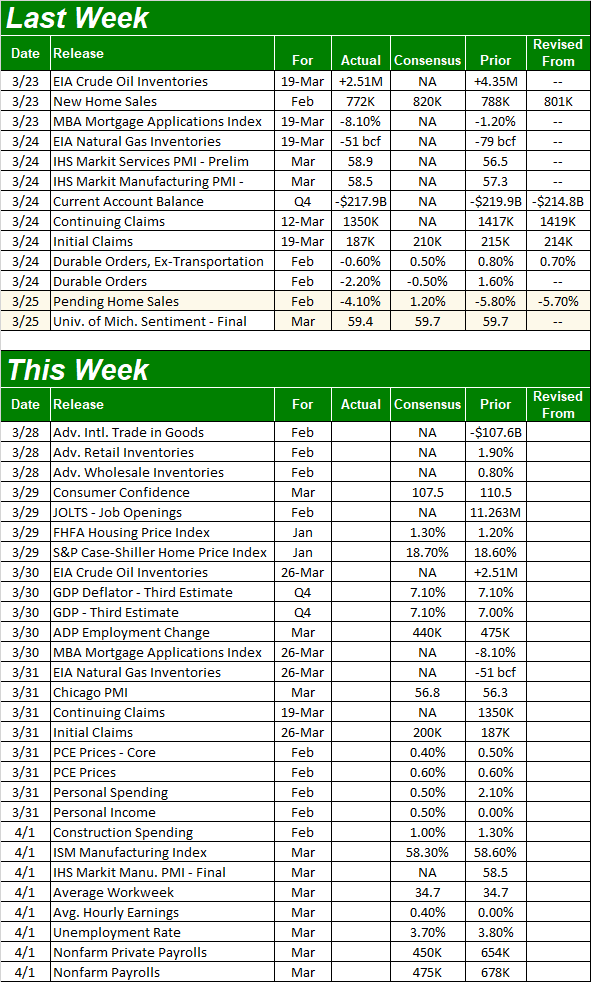
Source: Briefing.com
This week looks like it's loaded, and there are some noteworthy items to be sure. But, not many of them are heavy-hitting reports.
The real estate picture continues to get rounded out, with the FHFA Housing Price Index and the S&P Case-Shiller Index both due on Tuesday. The numbers are only for January, and forecasters believe at that point home prices were still rising at a rapid pace. Just keep in mind that real estate's headwind -- if there is one -- didn't start to take shape until February. Much has happened in just the past few weeks.
Home Price Charts
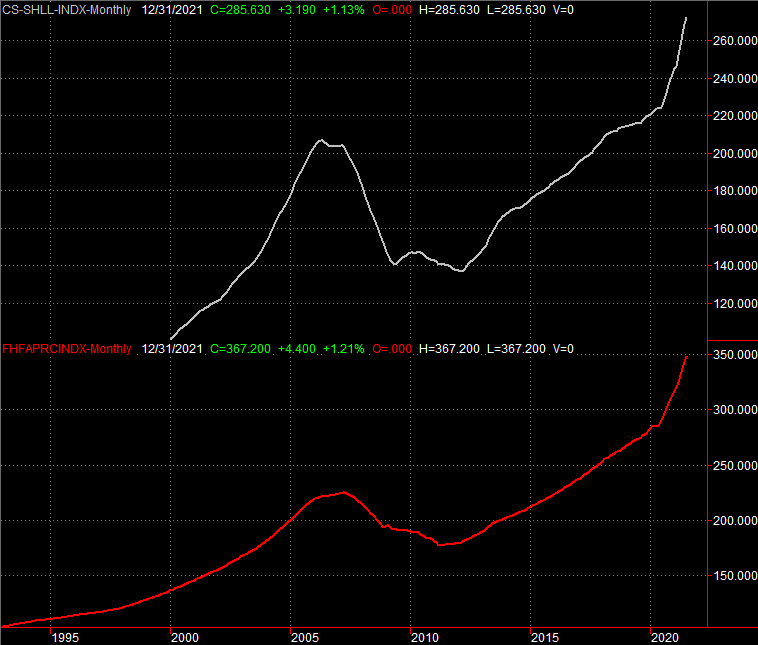
Source: Standard & Poor's, FHFA, TradeStation
On Friday we'll hear March's ISM Manufacturing Index figure. We'll likely get another lull, renewing a downtrend that was briefly interrupted in February. The forecast for a reading of 58.3 is still well above the 50 level that separates growth from contraction. But, we'd still like to see rising figures.
ISM Services and Manufacturing Index Charts
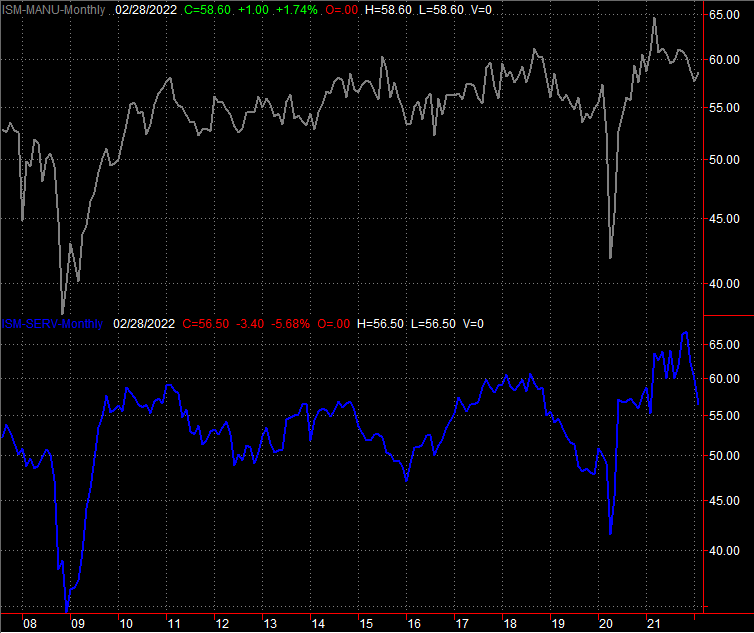
Source: Institute of Supply Management, TradeStation
The ISM Services Index for March will be posted next week. That measure been falling fast.
This week's biggest economic news, of course, will be Friday's jobs report for March. Economists believe we added 475,000 new jobs this, slowing from February's job-growth pace but still enough to pull the unemployment rate down from 3.8% to 3.7%.
Payroll Growth and Unemployment Rate Charts
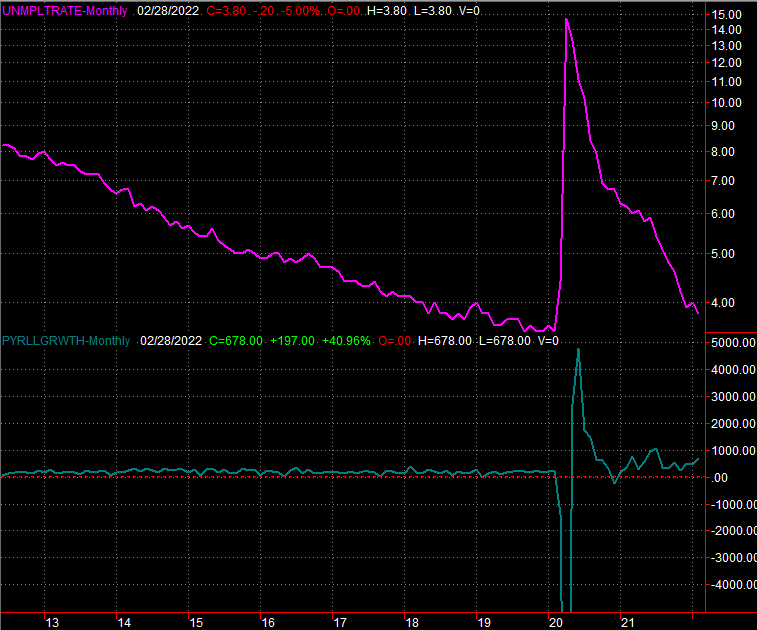
Source: Institute of Supply Management, TradeStation
Stock Market Index Analysis
With nothing more than a passing glance the rally looks solid enough. Stocks scored their second week of gains, and while the second of those two weeks wasn't as fruitful as the first, the S&P 500's 1.8% last week is solid in the grand scheme of things. And as the old adage goes, the trend is your friend....
...except, the rally to-date isn't exactly picture-perfect. A couple of concerns take shape when you take a longer look at the charts.
To this end, we'll start this week's analysis with a look at the daily chart of the NASDAQ Composite, as this is where the worry is most evident. Take a look, and notice how each day's higher high from last week was less progressive than the last. In other words, the momentum is slowing down, and it's slowing down from the index that should be leading the broad market's charge.
NASDAQ Composite Daily Chart, with VXN
Source: TradeNavigator
It's not all bad news. The NASDAQ itself broke above the 50-day moving average line (purple) at 13,771 last week, and the NASDAQ Volatility Index (VXN) touched a new multi-week low on Friday, suggesting there's a little conviction behind the shallow gains; traders were getting more aggressive right in front of the weekend.
Still, the rally's slowdown is clear. Here's what that looks like in the weekly timeframe. Again, notice how the 38.2% Fibonacci retracement line likely played a key role in the rebound effort that took shape three weeks ago. The weekly chart also shows us there's a little bit of daylight between where the composite is now and the next technical ceiling around the 14,700 area.
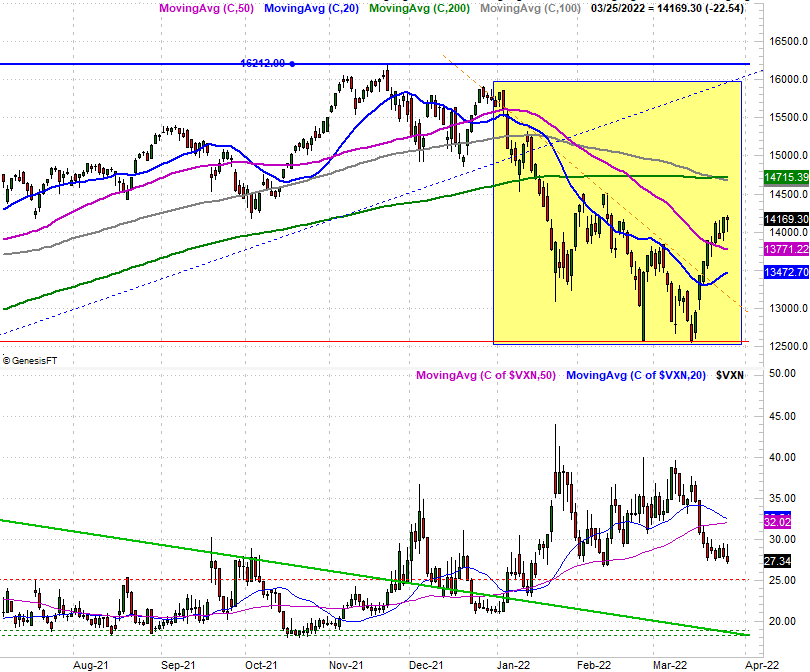
NASDAQ Composite Weekly Chart, with VXN

Source: TradeNavigator
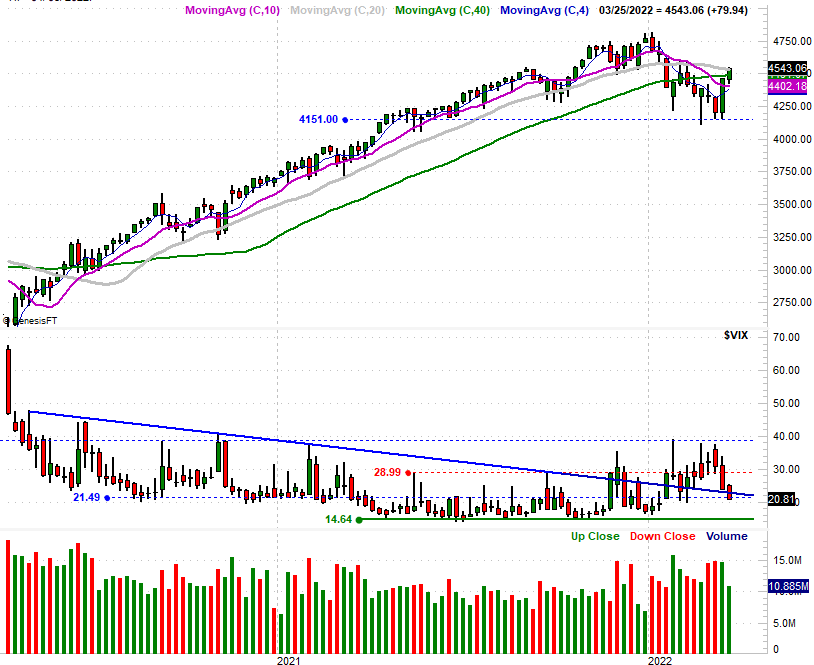
Interestingly, the daily chart of the S&P 500 isn't showing us the same slowdown. Its day-to-day change in highs was just as healthy on Friday as we saw earlier in the week, suggesting there's just as much momentum as of last week's close as there was early on.
The daily chart of the S&P 500 still shows us a couple of key red flags, however.
One of those red flags is the fact that the index was stopped cold when it bumped into the 100-day moving average line (gray) at 4543. Perhaps the bigger red flag evident on the daily chart, however, is the fact that volume was waning all the way up. Although the market is making good progress, fewer and fewer people are actually willing to buy stocks the higher they go right now.
S&P 500 Daily Chart, with VIX and Volume

Source: TradeNavigator
The weekly chart of the S&P 500 really shows us how much volume dried up last week. Of course, the weekly chart also tells us the S&P 500 Volatility Index (VIX) tiptoed into new multi-week low levels last week. So, it's not like there are no bulls out there.
S&P 500 Weekly Chart, with VIX and Volume
Source: TradeNavigator
While we typically don't look at it, this week we'll add a daily chart of the Dow Jones Industrial Average just because it confirms so much of what other charts are telling us. That is, there's really not a lot of buying going on here - not even of blue chips - given the Dow's waning volume. And, the Dow itself did not hurdle its 200-day moving average line (green) at 34,983 last week. That's an important make-or-break line in the sand for any index.
Dow Jones Industrial Average Daily Chart, with Volume

Source: TradeNavigator
This week is going to be a test. Some major hurdles are ahead, and while it looks like there's enough momentum to clear them, traders are balking. That's not necessarily a bearish sign either, as there's room for a lull that will allow the bulls to regroup and try to move to the next technical level again. The smart-money move right here and now is just waiting and seeing how this all shakes out.