Stocks logged another gain last week, but it was far from being inspirational. The S&P 500 continues to struggle with technical resistance near its February peak, and the volume behind the NASDAQ's gain continues to deteriorate. Traders simply don't have much conviction that there's any more upside left to tap into.
We'll explore that idea in detail below, but first, let's recap last week's major economic announcements and preview what's in store for this week. It's a particularly big week for real estate data, though we're going to be hearing a couple of key consumer sentiment reports as well.
Economic Data Analysis
It wasn't a terribly busy week in terms of economic news, but a couple of the news items we got were important, and encouraging.
For instance, the housing starts and building permits figures for July were not only up, but much better than expected. Starts came in at 1.496 million (annualized) versus an expected 1.23 million, and issued permits hit a yearly pace of 1.495 million versus calls for only 1.3332 million. Consumers are taking advantage of record-low mortgage rates.
Housing Starts and Building Permits Charts
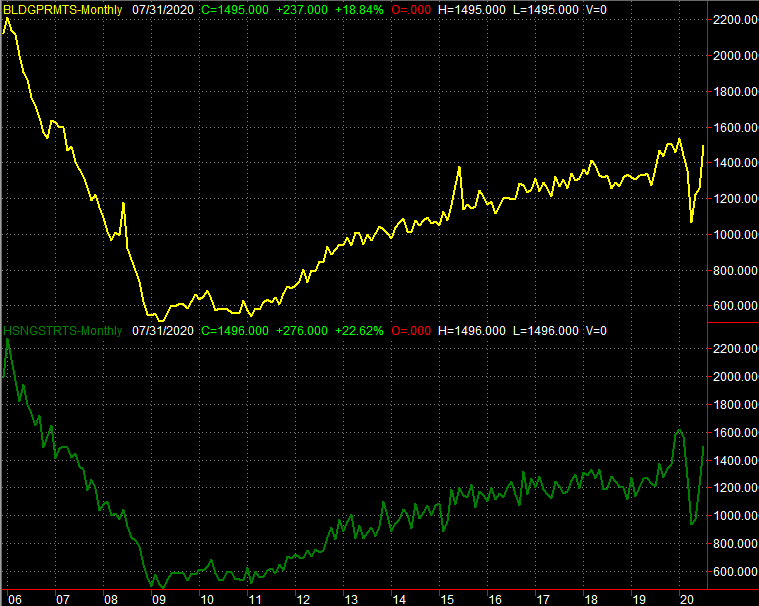
Source: Federal Reserve, TradeStation
That theory is underscored by the number of existing homes consumers purchased last month. The National Association of Realtors reported that homes already built were snapped up in July at a pace of 5.86 million, well up from June's 4.7 million. Economists were only modeling 5.39 million. That data set will be rounded out this week with a look at last month's sales of new homes. See below. Everything else is on the grid.
Economic Calendar

Source: Briefing.com
As was noted, new home sales will be released this week... on Tuesday. Forecasts aren't calling for significant growth, but they weren't modeling the big existing home sales surge either.
New Home Sales Chart
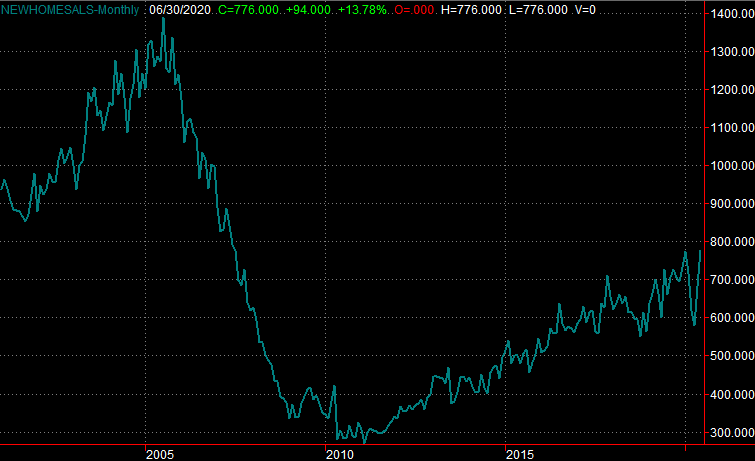
Source: Census Bureau, TradeStation
In the same vein, we'll get a couple of different (but related) updates on home prices. This has been something of a weak point for housing, but economists don't think we're headed into any serious trouble yet. In fact, they're still calling for a little progress.
FHFA Housing Price Index & Case-Shiller Home Price Index Charts
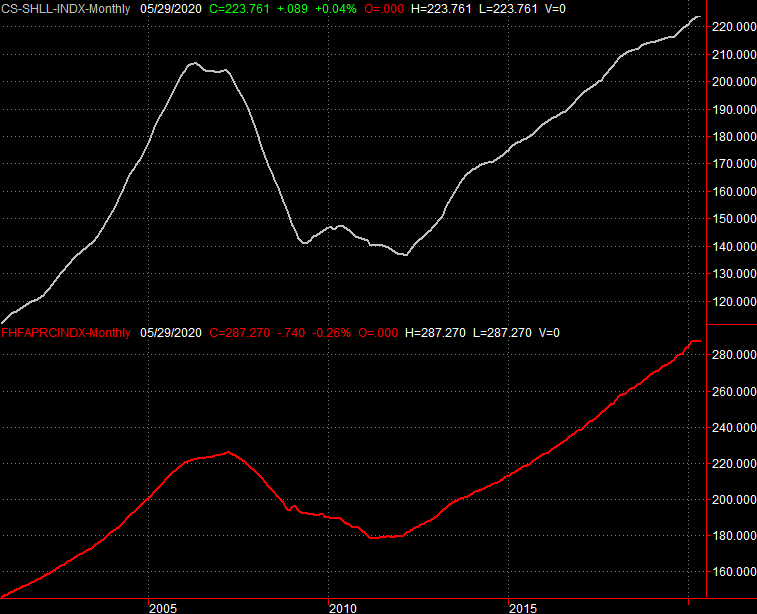
Source: FHFA, Standard & Poor's, TradeStation
Finally, we'll get looks at consumer confidence this week, on Tuesday, and then again on Friday. Sentiment has bounced back from lows hit just a few weeks ago in the immediate wake of COVID-19s arrival, but nobody's looking for a lot of improvement for August... just more of the same.
Consumer Sentiment Charts
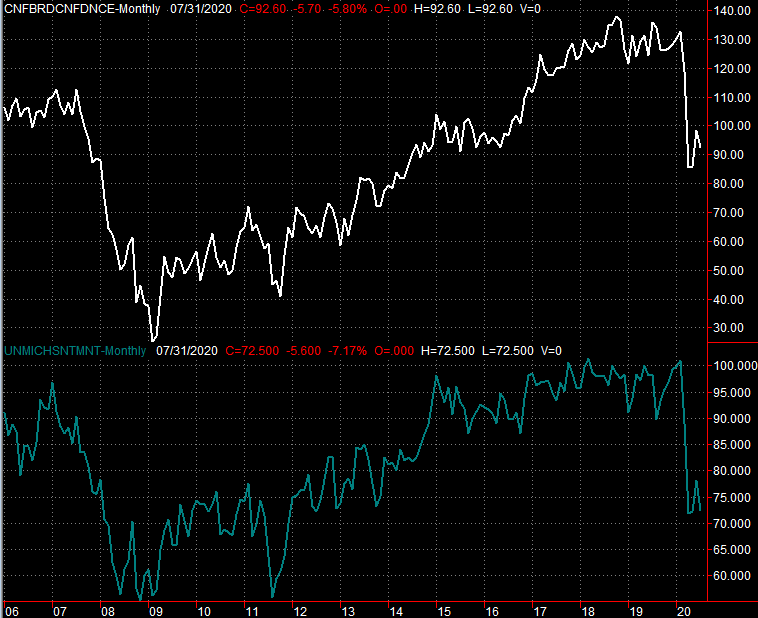
Source: Conference Board, University of Michigan, TradeStation
We're also going to hear the second estimate of Q2's GDP growth rate. Don't be surprised to see a big change from the first estimate of -32.9%. The economic volatility has been so great of late, economists are scrambling to come up with what are only semi-educated guesses. Regardless of a change, the number's sure to remain ugly.
Stock Market Index Analysis
The S&P 500 logged a gain last week, but not a big one. All told, the large cap index rallied 0.7% over the course of the five-day stretch. The high of 3399.96 is so barely better than February's peak of 3385.0 that it's almost not worth mentioning. The volume behind last week's modest advance was also not only weak, but extends a streak of weakening volume in step with the market's continued (and increasingly lethargic) gains since the middle of last month. The weekly chart of the S&P 500 tells the undisputed story.
S&P 500 Weekly Chart, with VIX and Volume
Source: TradeNavigator
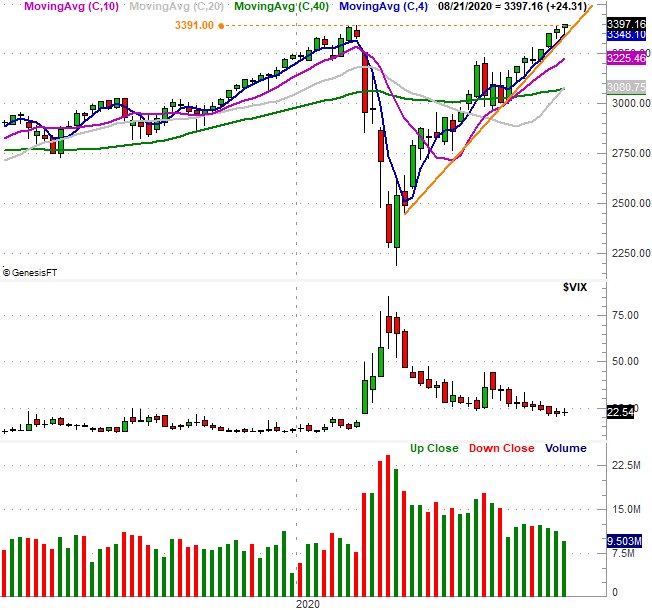
The daily version of the S&P 500's chart offers a little more detail on that technical ceiling, but also shows us another important aspect the recent action.... the market's still above critical support lines, the most important of which is the orange support line that connects all the key lows going back to the early April low.
S&P 500 Daily Chart, with VIX and Volume
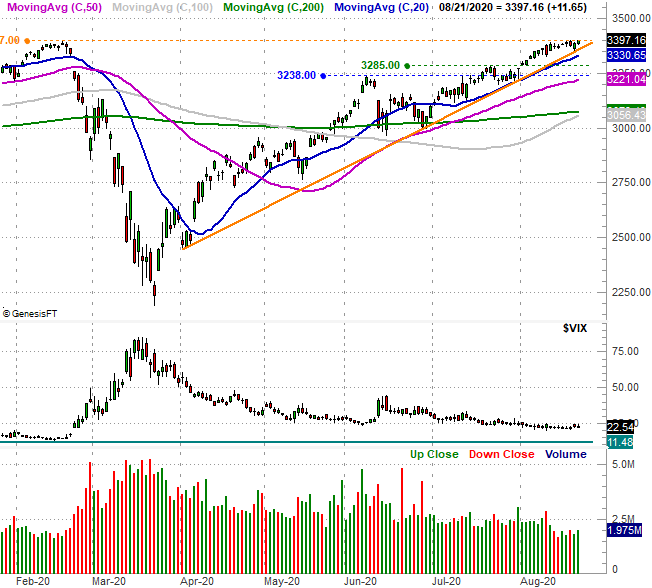
Source: TradeNavigator
The NASDAQ Composite is faring better. Much better, in fact. The index is now up 70% from its March low, blasting past its February high in June. More importantly, it remains above its 20-day moving average line (blue) and within the rising trading channel - framed in orange - that started to take shape in April. It's technically overbought, but hardly in jeopardy yet.
NASDAQ Composite Daily Chart, with VXN
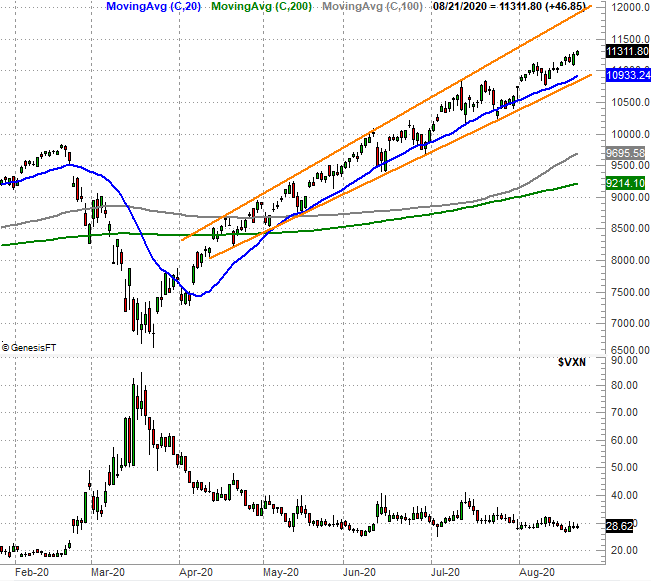
Source: TradeNavigator
With just a quick glance this seems to solve the problem we brought up earlier this month. That is, the NASDAQ appeared to be slowing down at the same time the blue-chip-oriented Dow Jones Index was heating up. That shift from aggressive and tech-laden growth toward safer stalwarts would imply investors are losing confidence (underscoring the fact that volume is shrinking on the way up). That may not be the inference anymore, however. The Dow actually lost a little ground last week despite Friday's gain. People are shifting back to aggressive growth.... sort of.
Dow Jones Industrial Average Daily Chart, with Volume
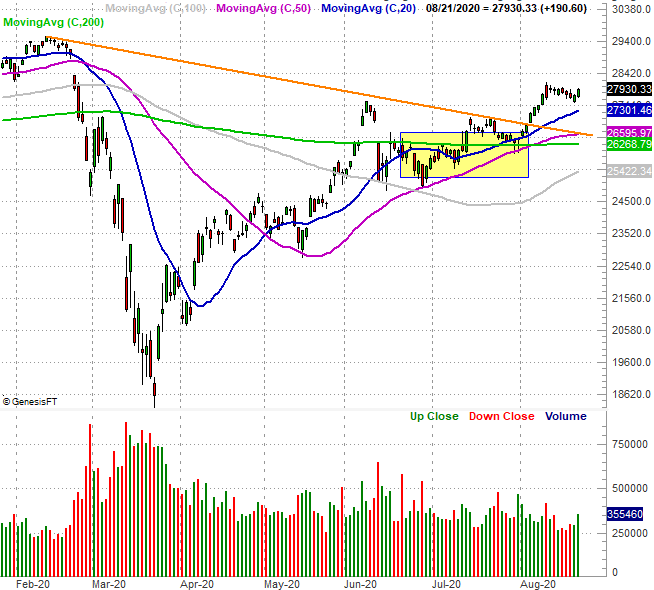
Source: TradeNavigator
Unfortunately, there's still more risk than reward ahead for the bulls. That's got a lot to do with the calendar. September is usually a loser for stocks, and the recent, unfettered runup means there's tons of profit-taking potential on the table. It's also worth noting that the broad market is right around where it would normally be at this point in the year, but is wildly higher than it would normally be at this point in the final year of a Presidential term.
S&P 500 Avg. One-Year Performance
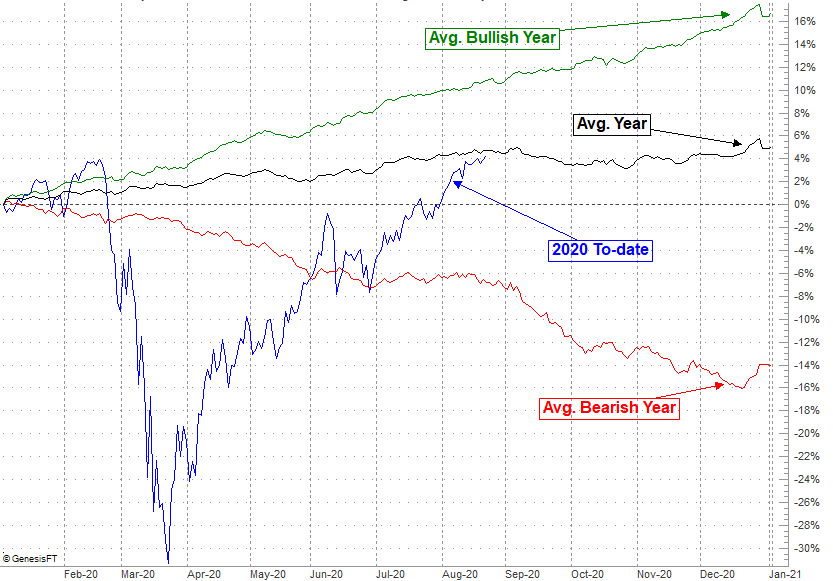
Source: TradeNavigator
S&P 500 Avg. Presidential Term Performance
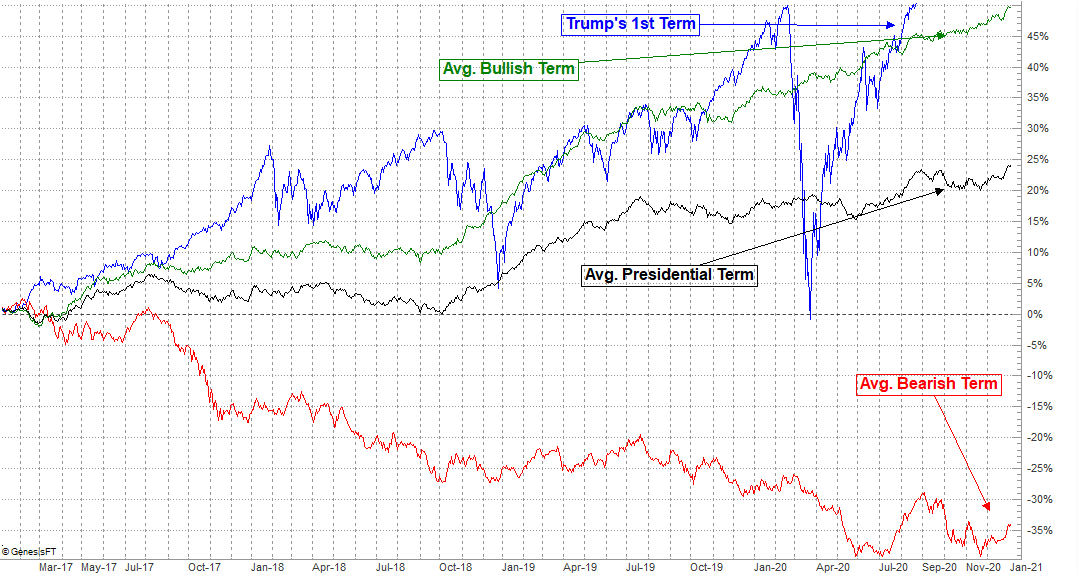
Source: TradeNavigator
The fear of missing out is still strong, and there are enough bulls seemingly seeking out good news to respond to. The backdrop suggests a pullback may be brewing though. A break below the key support lines could extend a little bit of selling into even more selling. In that event, look to the 100-day and 200-day moving average lines as technical floors.