Stocks ended the week with a gain, but all of that gain was reaped on Monday. The market drifted downward over the course of the last four days of last week, with traders neither buying nor selling in a big way to start the new year off with (or without) any particular positions.
Generally speaking, the whimpering action would suggest we're starting this new week off on a slightly bearish foot. Don't read too much into the year-end action though. It was just that ... year-end. Even if the action was muted, that might have merely been the result of people thinking about other things. They might start the new year off with a great deal more vigor, and more bullishness. The first few days of new years are typically net winners, after all.
We'll look at the market's current condition in a moment. First, let's paint the longer-term picture using some broad brush strokes of last week's and this week's economic reports.
Economic Data Analysis
There were only a couple of data nuggets posted last week worth a look today... both of which rounded out the current real estate picture. The Case-Shiller Index as well as the FHFA Housing Price Index both edged a bit higher, reaching records -- again -- in the process. The headlines painted a somewhat alarming picture, pointing to the fact that the pace of price increases is measurably slowing. Take that angle with a grain of salt, however. Home value improvements are slowing down from a red-hot pace reached earlier this year. They're still growing at a firm double-digit clip.
Home Pricing Charts
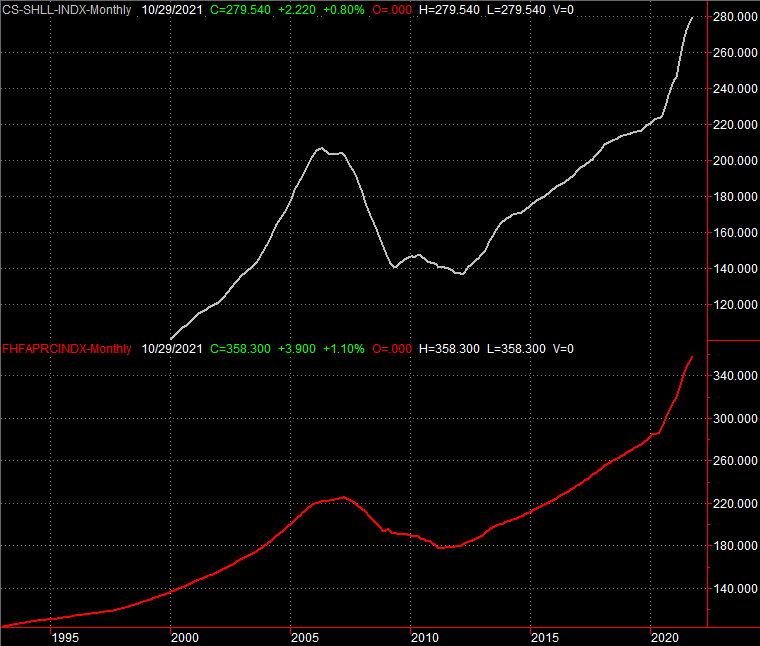
Source: Standard & Poor's, Case Shiller, FHFA, TradeStation
Do bear in mind that both of the aforementioned home price measures are only as-of October. Much may have changed during the two months in the meantime. At least through November though, sales of existing homes are back on the rise, while sales of new homes are mostly on the mend after tumbling in mid-2021. Building permits and housing starts were also up in November, with starts reaching their highest level in months.
Still, the sheer scope of the meteoric rise in home prices presents a potential problem. That is, it leaves prices vulnerable to a sharp contraction, which could have a ripple effect on other aspects of the real estate market like unit sales and starts.
Everything else is on the grid.
Economic Calendar
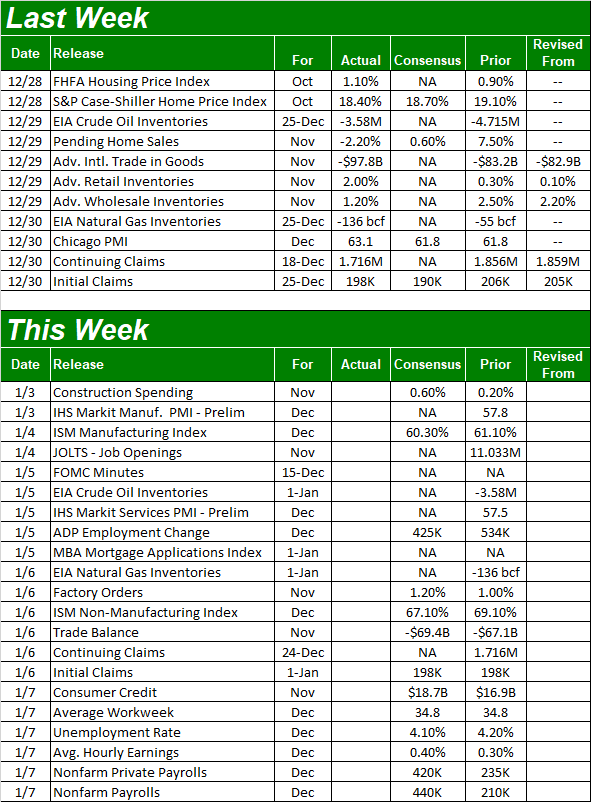
Source: Briefing.com
The first week of the new year kicks off with a relatively big bustle of news, with the grand finale being Friday's jobs report for December. There's a pair of related reports coming due in the meantime, however, that we'll want to make note of. The Institute of Supply Management's manufacturing index figure will be posted on Tuesday, and the services index is coming on Thursday. Both are well above the critical 50 level that delineates growth and contraction.
ISM Index Charts

Source: Institute of Supply Management, TradeStation
As for the jobs report,look for more -- and slightly accelerated -- progress.
Unemployment and Payroll Growth Charts
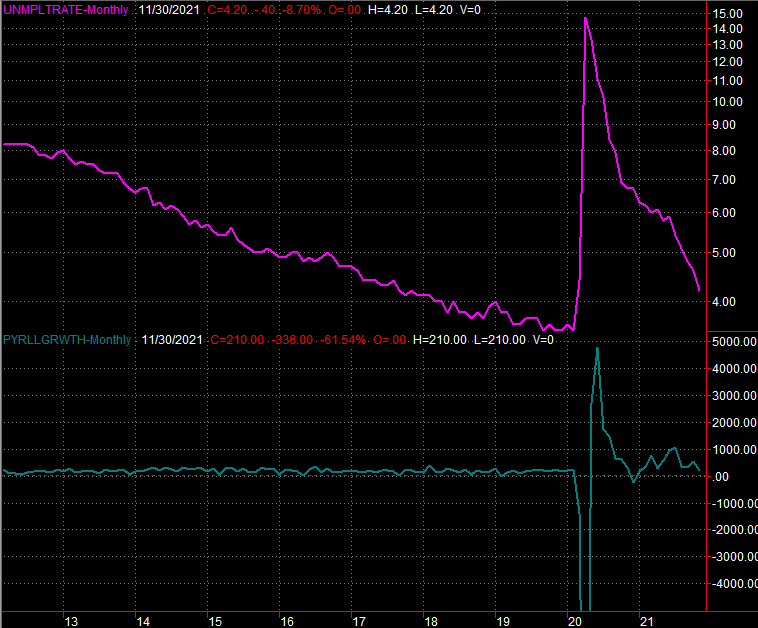
Source: Department of Labor, TradeStation
Stock Market Index Analysis
We'll kick this week's analysis off with a look at the daily chart of the S&P 500, primarily to point out how all of last week's gain too shape on Monday. The market was progressively weakening as the rest of the week wore on, starting stocks on the wrong foot to begin the new year.
S&P 500 Daily Chart, with VIX and Volume

Source: TradeNavigator
Interestingly, the NASDAQ Composite did the exact same thing.
NASDAQ Composite Daily Chart, with VXN
Source: TradeNavigator
Don't read too much into the shape of the week. Traders may not have been buyers headed out of one year and into the other, but that may only mean they were happy with what they owned a week ago and simply didn't see any need to make any moves. You'll also see that despite the lull, both indices are still above key technical support lines.
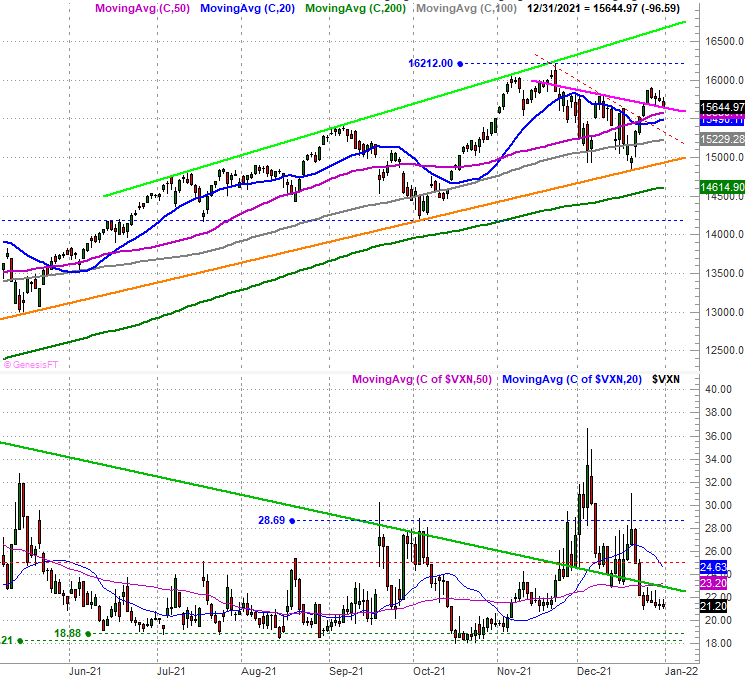
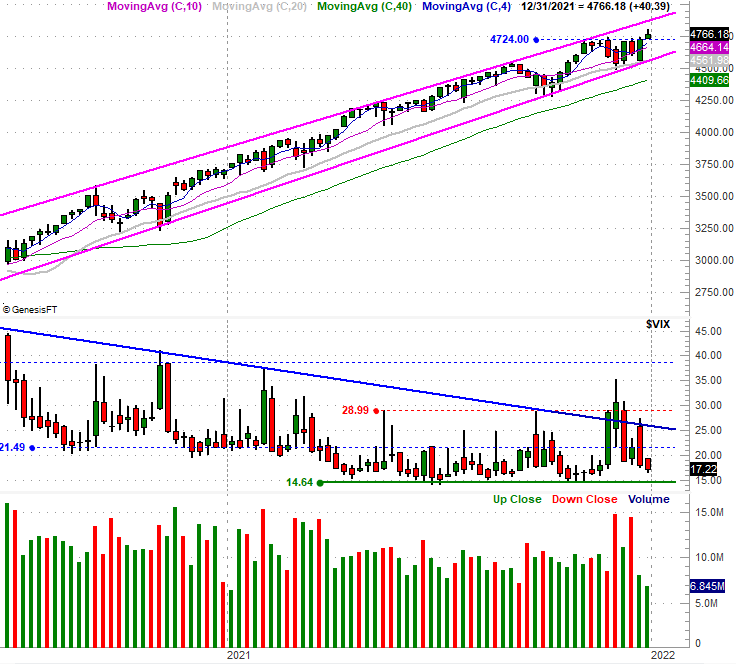
Zooming out to a weekly chart of the indices puts things in a better perspective. The S&P 500, for instance, managed to break above a major technical ceiling around 4724, though it also gave up most of that intraweek gain to leave behind a gravestone doji bar... a bar where the open and close are at (or at least near) the low for that period. The shape of that bar suggests a transition from a net-buying to a net-selling environment. The weekly chart also tells us the S&P 500's volatility index (VIX) is nearing an absolute floor near 14.6; getting there will make it tougher for the market to continue rallying.
S&P 500 Weekly Chart, with VIX and Volume
Source: TradeNavigator
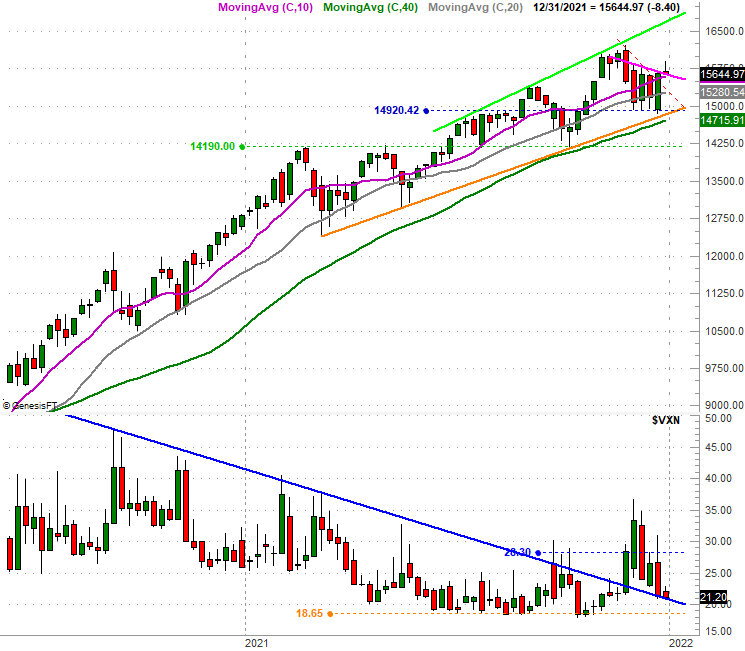
The NASDAQ Composite's doji is even more pronounced, and the composite wasn't even able to touch a record high; it struggled to creep into multiweek high territory.
NASDAQ Composite Weekly Chart, with VXN
Source: TradeNavigator
The challenge to the "it's not a big deal" assessment is, it's so unusual. But, in this particular case, the weak end to the year isn't wildly surprising.
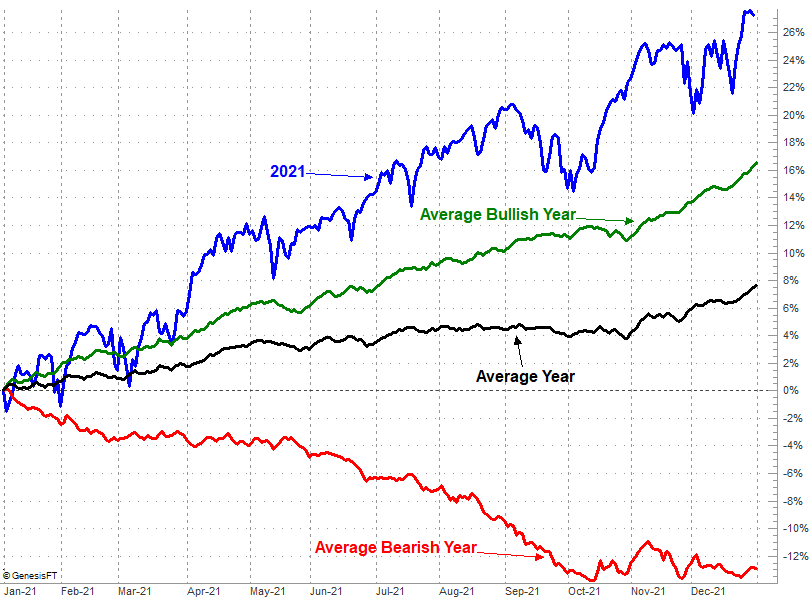
The image below is eye-opening. The market almost always ends the year on a bullish foot. It didn't this year though, perhaps because it logged a full-year gain of 27% -- the eighth best year since 1951 -- and there just wasn't room for more gains. The big move also leaves stocks ripe for weakness to kick 2022 off, and it's not as if January is usually a wildly bullish month (even if it typically logs a small gain of around 1.0%).
S&P 500 2021 Day-to-Day Total Performance vs. Average
Source: TradeNavigator
The smart-money move here may be simply doing nothing until it's clear what traders are collectively thinking here at the beginning of the new year. The good news is, the indices' lines in the sand are still pretty clear... the same ones we've been watching for the past several weeks. It shouldn't take too long for the market's actual undertow to reveal itself.