Weekly Market Outlook - An Ugly Win is Still a Win
 Last week's gain was a "just barely" situation, and the market didn't exactly end the trading week on a bullish foot. It's not like the bears even bothered to make an effort to show up though. Of course, the bears may just be biding their time, waiting for more convincing proof that any modest slide isn't going to be stopped and reversed as quickly as the last several have been.
To that end, however, the ingredients for a small pullback are in place. We can show you the exact spot where the S&P 500 hit a familiar wall, and we will, right after a run-down of last week's and this week's economic news.
Economic Data
There wasn't a lot of economic news to sift through last week, but the two noteworthy items were VERY noteworthy.
First, inflation is still solid, picking up some steam last month whether you're talking about for consumers or producers. The overall consumer inflation rate stands at 3.2% right now, and is up 1.7% on a core basis. Producer inflation is roughly the same, and, most inflation rates are on the rise. The Fed has even more room and reason to impose the rate hike most investors now expect for September.
Inflation (Annualized Rates) Charts
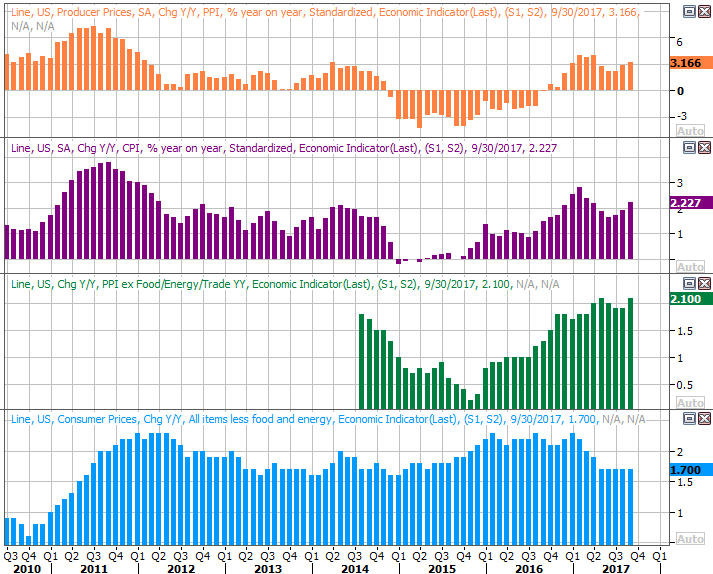
Source: Thomson Reuters Eikon
The other biggie from last week was September's retail sales, which were up in a big way on a year-over-year basis. We took a closer look at all the data stratifications at the website here, but the gist is, consumerism is alive and well. It has been for some time now, and that's good for earnings, which is in turn good for stocks. The market is still overvalued, to be fair, but the bullish undertow is still in place. Any pullbacks won't mean the beginning of a bear market.
Retail Sales Growth Charts
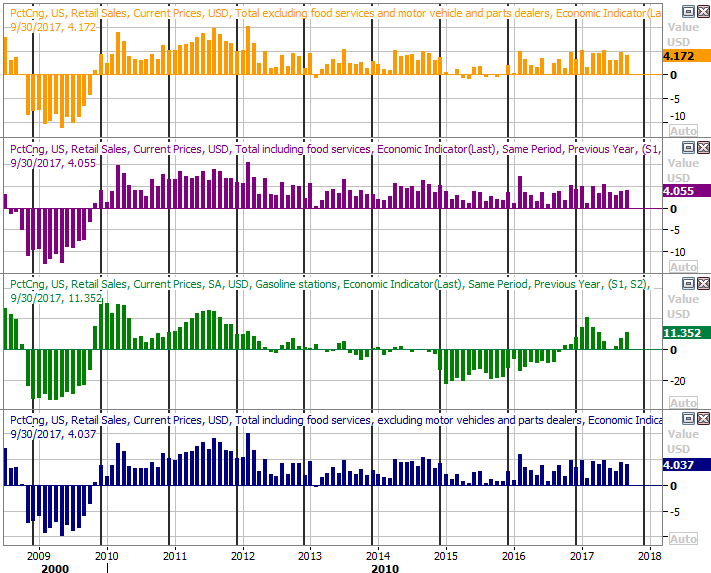
Source: Thomson Reuters Eikon
Everything else is on the grid.
Economic Calendar
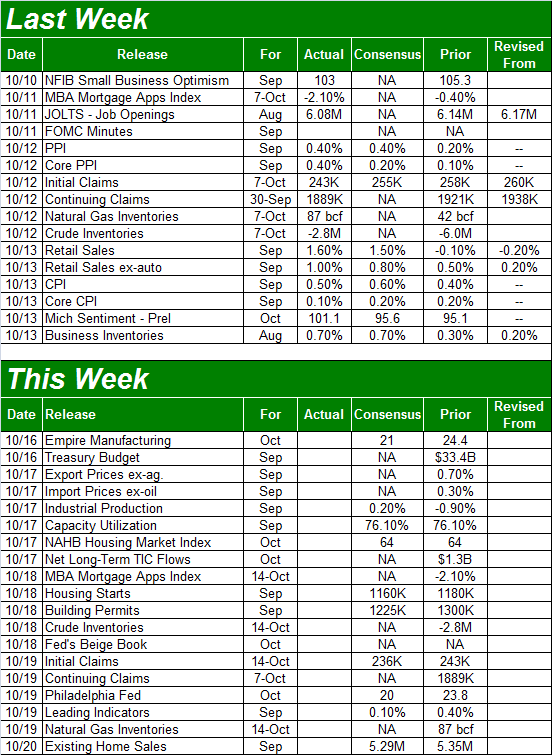
Source: Briefing.com
This week will be a little busier, with three rounds of news being of heightened interest.
The first biggie is last month's capacity utilization and industrial productivity data, coming on Tuesday. August's numbers were skewed by one hurricane, and last month's data will also likely be suppressed thanks to Irma. If the numbers are less than thrilling -- and the pros aren't expecting anything otherwise -- don't sweat it. The repair and the rebuild effort can actually be somewhat simulative.
Capacity Utilization and Industrial Productivity Charts
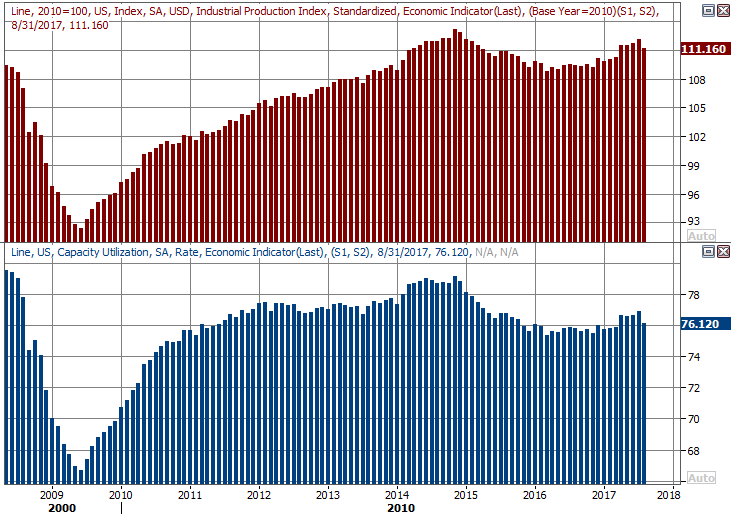
Source: Thomson Reuters Eikon
We'll also get last month's housing starts and building permits report on Wednesday. Yes, the hurricane has put the kibosh on this data too, though not dramatically. Economists are only expecting a small taper from August's data. Either way, the trend was flattening even before the storms had a chance to disrupt some key construction markets.
Housing Starts and Building Permits Charts
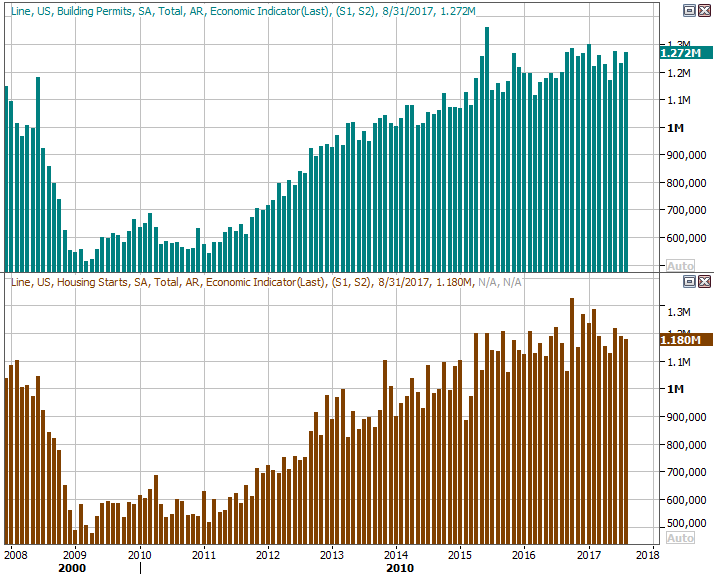
Source: Thomson Reuters Eikon
Last but not least, though we won't round out the whole picture until next week's new home sales report for August, we'll get the ball rolling this week -- on Friday -- with last month's existing homes sales report. You may recall both were tapering off for the past few months, leading to swelling inventory... at least new-home inventory. Don't expect much change in September's existing-home sales, though we'd certainly like to see one.
New and Existing Home Sales Charts
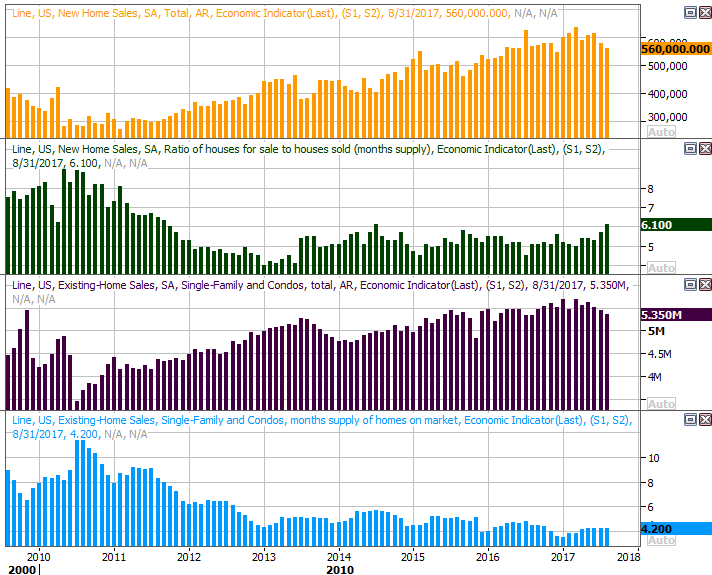
Source: Thomson Reuters Eikon
Index Analysis
We're going to start this week's look at the indices with an examination of the weekly version of the S&P 500's weekly chart, simply because it's more important to understand where we are in the bigger picture before drilling down into the details.
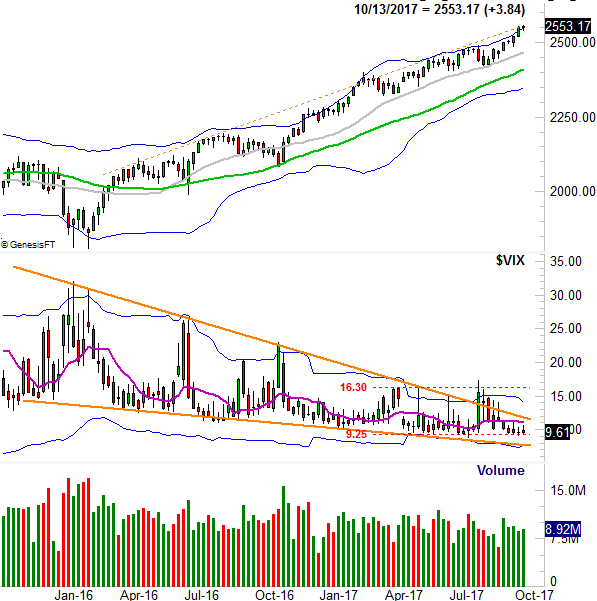
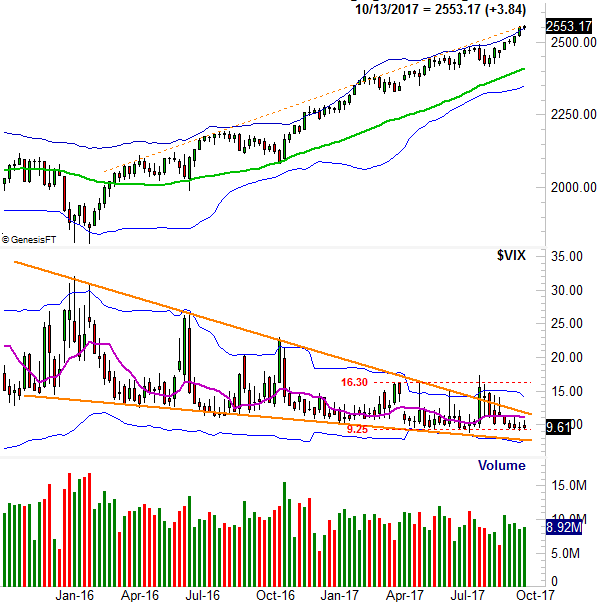
Take a look. As you can see, the S&P 500 -- thanks to this month's unlikely advance -- is at a resistance line (orange, dashed) that's tagged all the major highs since early 2016. While this doesn't necessarily mean the rally has to end here, this is where the bears have a good chance of stopping and reversal the rally (even if just temporarily).
S&P 500 Weekly Chart
Source: TradeNavigator
You can also see the VIX is back to extreme lows, though not as low as it could plausibly move. The lower edge of the descending wedge pattern (framed by orange lines) is still a little bit below the VIX's current value. On the other hand, there's a floor at 9.25 that's been holding up since May. That may be the more relevant floor right now.
Zooming into a daily chart of the S&P 500 we can see that the market's ebb and flow has been plenty reliable for months now, pulling back after any and all modest advances. To that end, you can see that while the market made progress last week, the pace of that progress slowed to a crawl. Already slowing down, the stage is pretty well set for a pullback now.
S&P 500 Daily Chart
Source: TradeNavigator
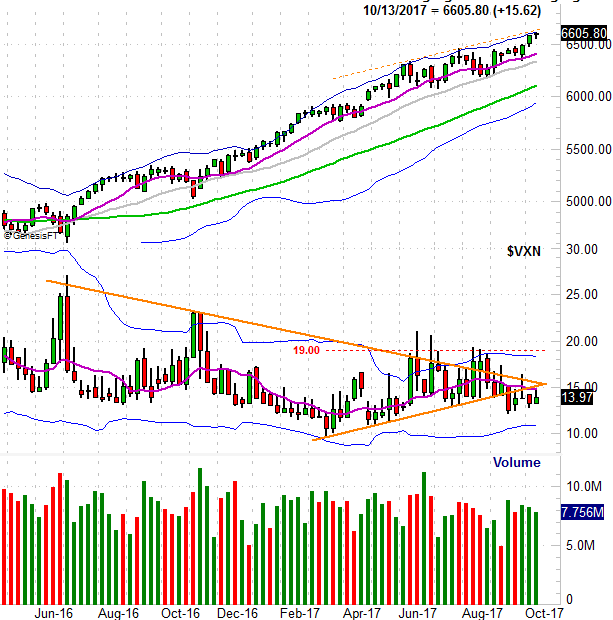
The weekly chart of the NASDAQ Composite doesn't tell us a whole lot more. It simply confirms how long it seems like the market's gone without even a minor corrective move... and how overdue we are for a pullback.
NASDAQ Composite Weekly Chart
Source: TradeNavigator
As for how this is all going to shake out, we obviously can't rule out a melt-up. Just bear in mind we've been teased with melt-ups in the recent past, to no avail. On the flipside, recent pullbacks haven't been back-breaking either. There are some clear lines in the sand, however, that will point out when any pullback will finally go from bad to worse.
They're on the weekly chart of the S&P 500... the 100-day moving average line (gray) and the 200-day moving average line (green). The 100-day line has reversed several of the lulls since April, and though the 200-day average line hasn't been tested since November of last year, it's still in play as a support level. Even if either of those moving average lines are merely tested without being crossed though, the trip between and there will feel relatively dramatic.
Whatever's in the cards, this remains a day-to-day decision affair... much more so than usual.