Weekly Market Outlook - ALMOST the Rally We Were Hoping to See

 All in all, the bulls don't have too much to complain about. The rally slowed down as the week wore on, but most rallies would which they reached the 10% mark. If nothing else, the buyers need to take a breather.
The question is, how long (and how big) does that breather need to be? If not very big, stocks are setting up for a nice January. A small stumble could easily turn into a sizeable setback, however, given the still-nervous mindsets of many traders.
We'll pinpoint what's still not-quite-right about the market below, but first, let's run-down last week's economic news. As it turns out, the inflation beast may have been fully tamed.
Economic Data Analysis
Last week was a relatively modest one in terms of the number of economic data nuggets we got, but a couple of them were hard-hitting numbers.
The party didn't start with one of the biggies, but Monday's look as the ISM Services Index does round out the ISM Manufacturing report we got last week for December. As expected, the non-manufacturing version of the index fell, but more than expected, from 60.7 to 57.6. Both reports fell quite a bit last month, raising red flags.
ISM Index Charts
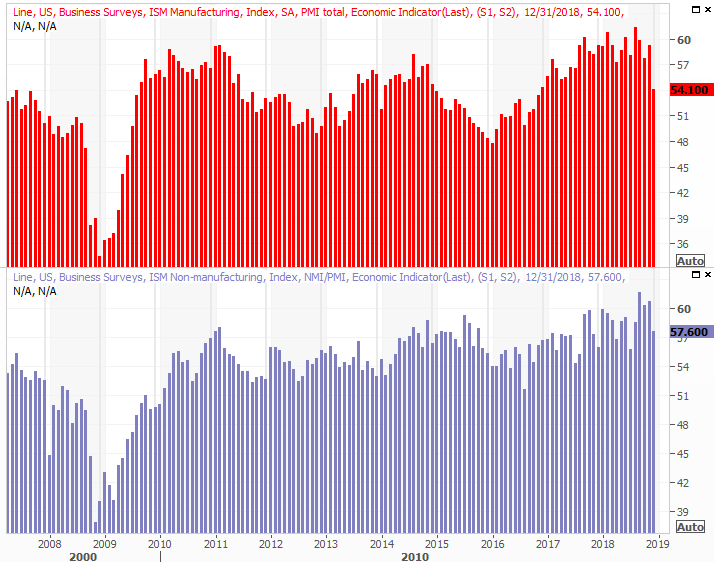
Source: Thomson Reuters
Bear in mind that the ISM Indices are rooted in perception polls rather than raw data reports. It's entirely possible business managers could have expressed concern over headlines that looked grim, but don't actually matter all that much.
Also last week the minutes from the most recent meeting of the Federal Reserve's governors were released. Though no quantifiable measure comes out with that release, qualitatively speaking, most agreed the Fed didn't need to be in a particular hurry in terms of ratcheting interest rates higher.
That premise was underscored on Friday, when last month's consumer inflation report indicated the slowest price increases since the middle of 2007. The current annualized inflation rate stands at less than 2%, after months of declines, and on a core basis is holding steady just above 2.0%.
Annualized Inflation Charts
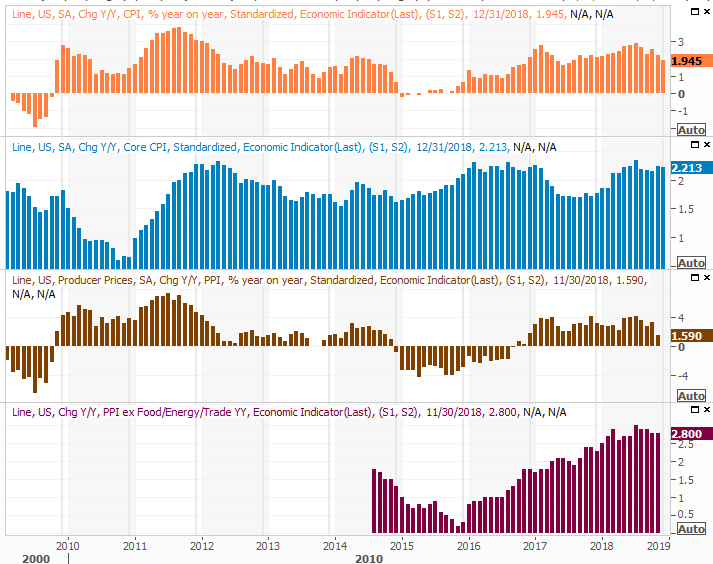
Source: Thomson Reuters
We'll get producer input cost data on Tuesday, but the pros expect companies are feeling the same limited levels of inflation consumers are.
Everything else is on the grid.
Economic Calendar
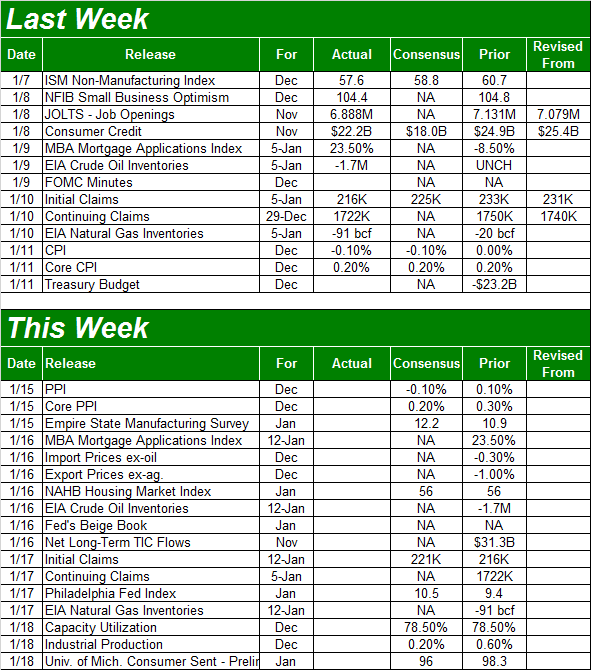
Source: Briefing.com
This week's going to be a bit busier, though beyond Tuesday's producer price inflation report, not much of interest is happening until Friday. But, Friday's is a monster-sized report even if most investors don't realize it.
We've mentioned it before but it bears repeating, the correlation between the Fed's industrial production index, corporate earnings and the long-term market trend is amazingly strong. Though the data doesn't help identify short-term swings, it does jibe with the long-term trend quite well.
To that end, economists believe last month's capacity utilization rates - which are already very high - will roll in at the same 78.5%. Industrial productivity, after improving 0.6% a month earlier, is expected to grow only 0.2% for December's report. Again though, it's being compared to an already-high figure.
Industrial Production, Capacity Utilization Charts
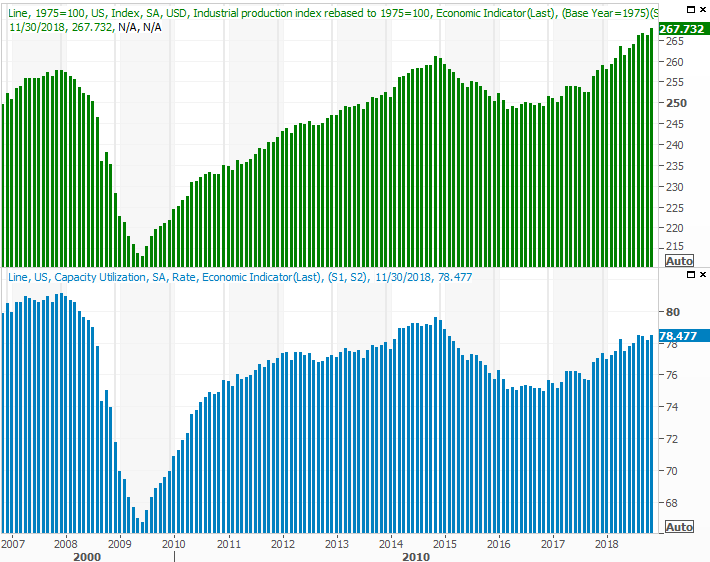
Source: Thomson Reuters
More often than not in recent months, the reports of both have surprised forecasters and continues to edge higher. If we see it happen again, it will largely negate the red flag waved by last month's ISM data.
Stock Market Index Analysis
It didn't end on the highest of notes, but the great start to last week still left the S&P 500 up 2.5% for the five-day stretch. Though the three-week rally is due for at least a breather from here, traders are increasingly convinced the market isn't necessarily doomed. Only time will tell if they remain in that mood once the rally is tested in earnest.
That test may be coming sooner than later.
There's no doubt the pace of the rally since the big December 26th reversal is slowing. Indeed, the S&P 500 only gained 0.8% during the last three days of last week. And, the below-average buying volume fell every day last week. The higher stocks goes, the less interested investors are.
S&P 500 Daily Chart, with Volume

Source: TradeStation
That's not necessarily a call for a complete unraveling of the market. Stocks starting to feel the weight of an overly-aggressive gain, but a modest lull may be all that's needed to hit the 'reset' button and renew the rally.
The weekly chart better illustrates why. As red-hot as the past three weeks have been, the S&P 500 has only reclaimed a fraction of what it's lost since September. And, the VIX still has lots of room to keep moving lower before it revisits more absolute support around 10.5. There's room for a small 'blip' here.
S&P 500 Weekly Chart, with Volume
Source: TradeStation
The key to keep the uptrend intact is not slipping below the 20-day moving average line, currently at 2521.
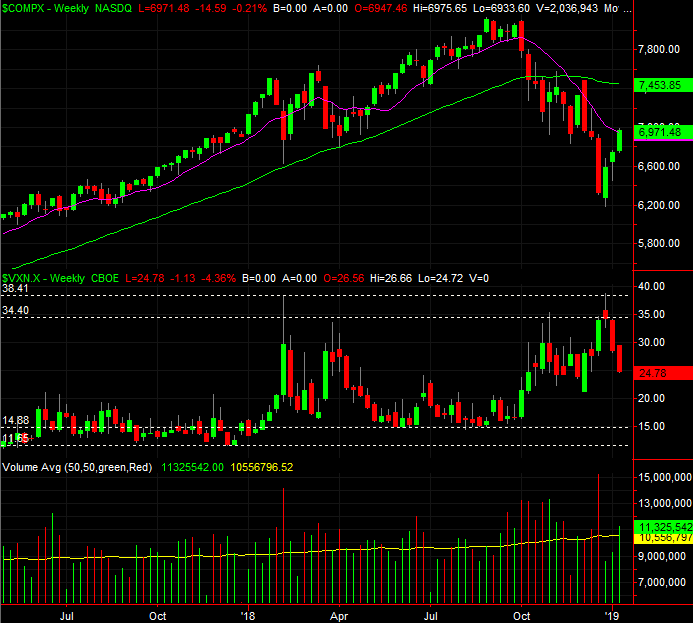
The same basic story and analysis applies to the NASDAQ Composite. That is, the uptrend is slowing now that the gains are getting large, and the buying volume is slumping the higher the composite climbs.
There are a couple of other noteworthy nuances for the NASDAQ though. One of them is, on the daily chart, the 50-day moving average line (purple) is coming back into play. It's at 7014 right now, and though the buyers were willing to test it last week, they weren't willing to push above it. Maybe there's something to it. Or, maybe not.
NASDAQ Composite Daily Chart, with Volume

Source: TradeStation
The other detail to note of the NASDAQ is how much room its Volatility Index, the VXN, has to fall before it finds a more familiar floor around 15.
NASDAQ Composite Weekly Chart, with Volume
Source: TradeStation
One final hint that while the uptrend thus far may be due for a break, it's still mostly a healthy uptrend - the breadth and depth we've seen for the past several days is bullish. Despite Friday's small loss, we saw more bullish volume than bearish volume, and we saw more advancers than decliners.
NYSE Breadth and Depth Trends, vs. S&P 500

Source: TradeStation
This is an unusual scenario to be sure. In a different environment against a different backdrop, this would be a firmly bullish development. Fear hijacked the market a few weeks ago though, and while it looks like most traders are getting past it, it would only took one wrong headline to put investors back into panic mode... merited or not. Tread lightly.
The good news is, the 20-day moving average lines are a clear support area, and the 50-day moving averages are clear resistance lines. Moving past either could be a catalyst.
It's too soon to start talking targets... bearish or bullish. Let's let a little more dust settle.