Weekly Market Outlook - A Valiant Effort, But the Bulls Ended Up Flinching

After a rough start to the trading week it looked as if the bulls were willing to regroup and start hammering out the next leg of the bigger-picture rally. Once that bearish gap was closed though, the bears dug in again. The coronavirus and drama in Washington D.C. got the blame, but it looked like this was set to happen no matter what. Worse, the damage done thanks to Friday's weakness was even more troubling than it might seem at first glance.
We'll discuss why that's the case below. First, however, let's run down last week's big economic announcements and preview what's in the cards for this week. It will all culminate in a very important jobs report for January.
Economic Data Analysis
For a third month in a row, new home sales cooled... not a lot, but enough to be concerned. Inventory ticked higher in December too, in contrast with December's existing home sales activity.
New, Existing Home Sales with Inventory Levels
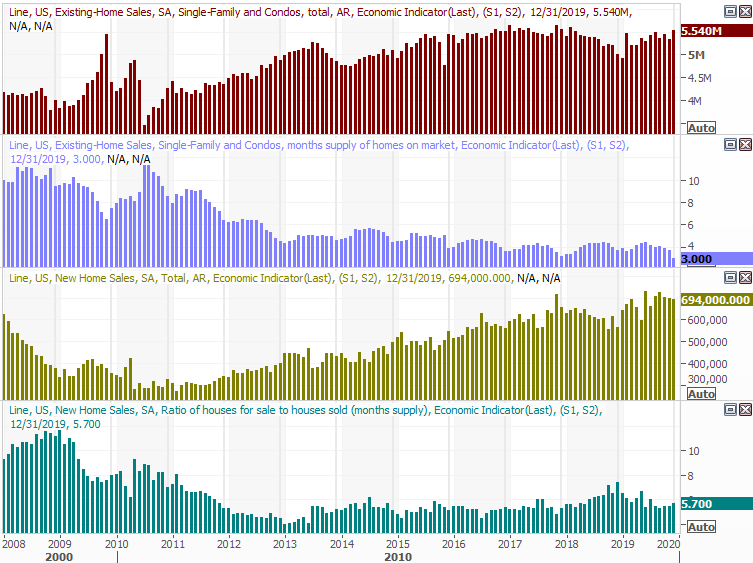
Source: Thomson Reuters Eikon
That disparity would raise more questions than supply answers were it not for the Case-Shiller Home Price Index report last week, which showed home values increased by 2.6% in November, versus expectations of a 2.5% improvement and October's 2.2% growth. Notice the FHFA Housing Price Index is also still marching higher, unfettered by what seems like turbulence.
FHFA, Case-Shiller Home Price Charts
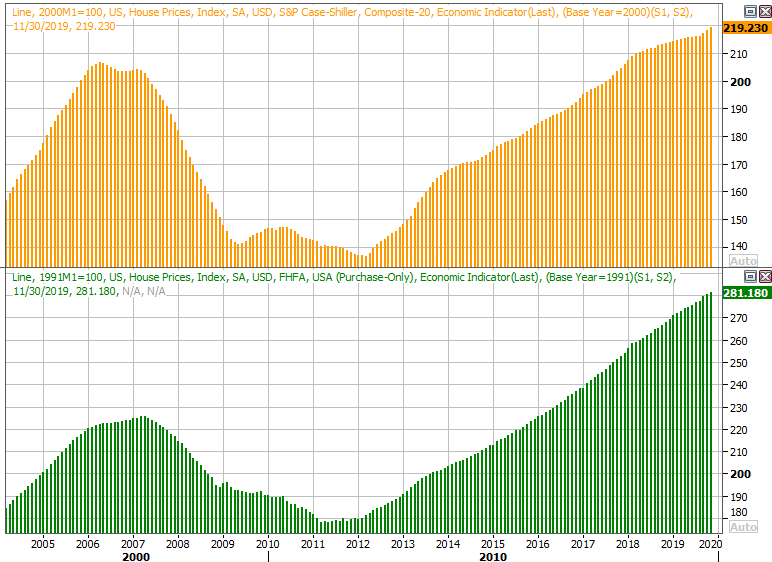
Source: Thomson Reuters Eikon
A rather important data nugget that came out last week was rather well buried by other headlines... Q4's initial GDP growth rate. The pros were only calling for 1.8%, to the 2.1% print was an encouraging reading.
GDP Growth Rate Charts
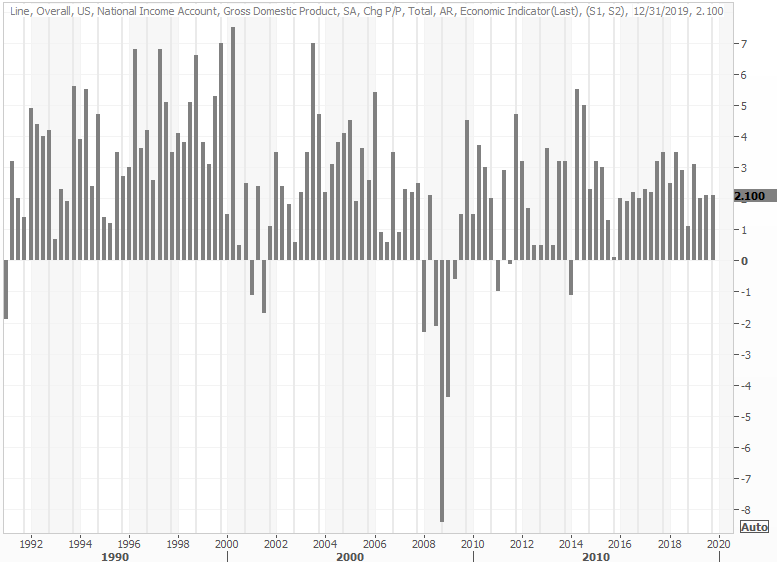
Source: Thomson Reuters Eikon
That's what makes last week's decision from the Federal Reserve to hold interest rates steady so apropos. The Fed Funds rate remains targeted around 1.63%. The economy isn't racing forward, but it doesn't need any real help either.
Everything else is on the grid.
Economic Calendar
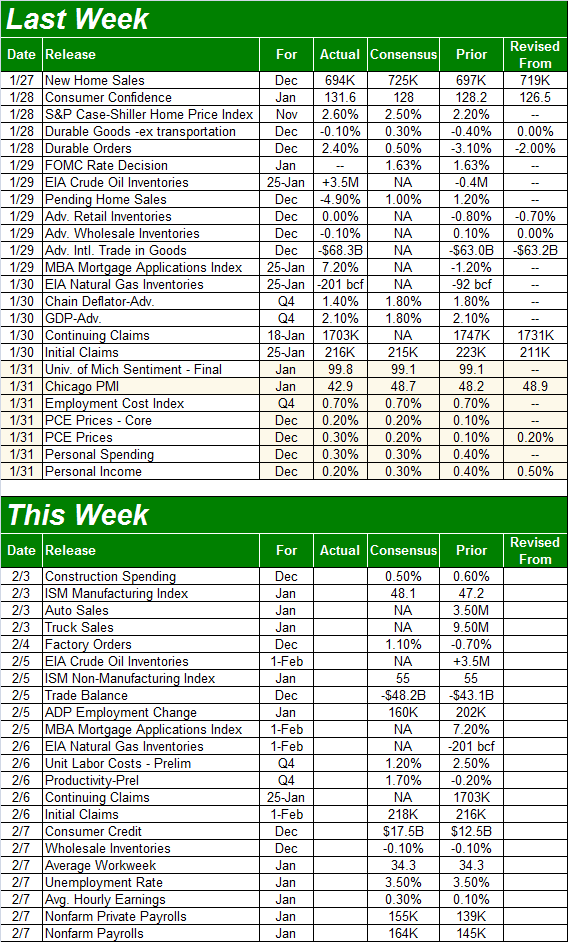
Source: Briefing.com
This week is a big one, though it would be even without last month's employment report capping it off.
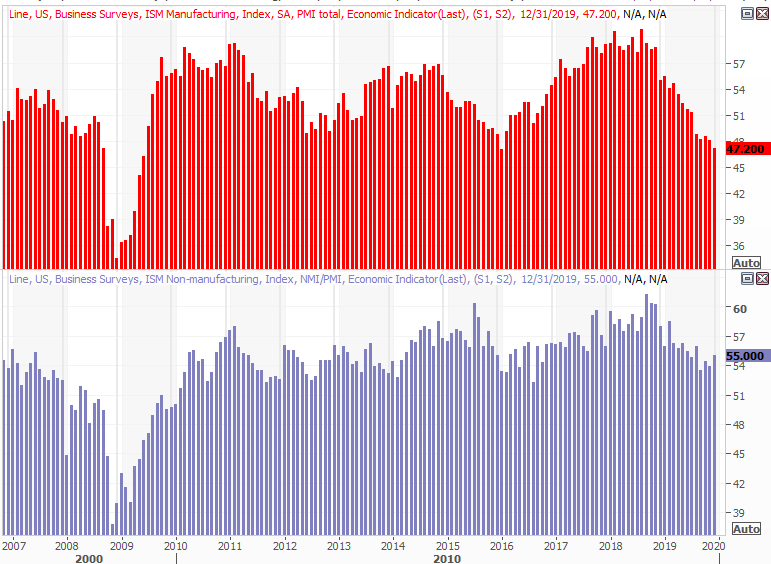
The party starts on Monday with the look at the first of this week's ISM numbers... the manufacturing index, to be followed by the ISM services index report on Wednesday. The manufacturing side of the data is expected to improve, though will still linger below the pivotal 50 level. But, the services index is expected to hold steady at 55.0. We could use help here, but bear in mind the manufacturing measure doesn't quite jibe Q4's GDP growth or consumer confidence. Just keep in mind it's an index of opinions of manufacturing managers, but they may be reading the landscape all wrong.
ISM Index Charts
Source: Thomson Reuters Eikon
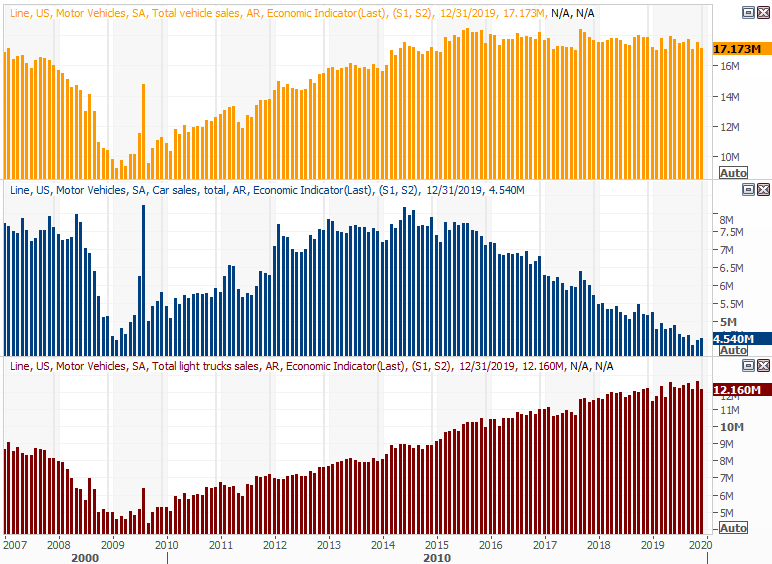
We'll also hear about January's auto sales on Monday. They've not been bad, but they have been dwindling - it's tough to maintain strong sales when the market is typically a cyclical one that's linked to the broader economic cycle.
Auto Sales Charts
Source: Thomson Reuters Eikon
The big Kahuna this week, however, will be Friday's jobs report. The numbers have been pretty consistently strong, and economists don't believe that trend has changed. They're calling for the unemployment rate to hold steady at 3.5%, prompted by the 164,000 jobs they believe were created last month. That's a decent improvement on December's 145,000.
Payroll Growth, Unemployment Rate Charts

Source: Thomson Reuters Eikon
Stock Market Index Analysis
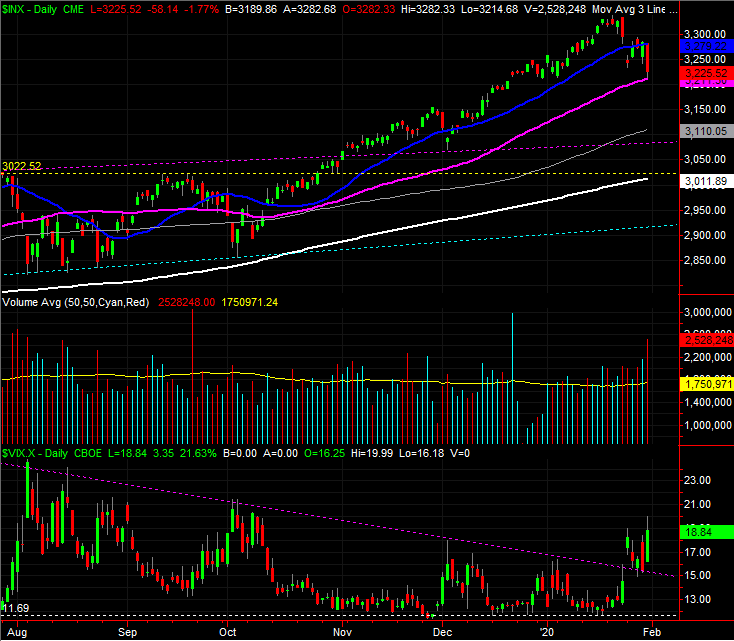
The bulls put up a tremendous fight, aiming to snap back from Monday's rough start. But, it just wasn't means to be. Monday's stumble weakened the broad market, leaving it vulnerable to the bigger blow suffered on Friday. Specifically, thanks to Friday's selloff, the S&P 500 is back below the 20-day moving average line (blue) after bouncing back above it after Monday. That's a first -- well, second -- since early December.
S&P 500 Daily Chart, with VIX and Volume
Source: TradeStation
Also notice, however, where Friday's selling finally stopped and was at least temporarily reversed. All it took was a kiss of the 50-day moving average line (purple) to stop the bleeding and give the bulls a chance to regroup.
That's hardly a convincing clue that the market is ready to rebound from here, however, for one particular reason.
Take a look at the VIX. The falling resistance line (purple, dashed) that had been guiding it lower since the middle of last year was broken last week, and stayed broken. And, secondarily, there's been plenty of bearish volume of late, and that bearish volume came flooding out on Friday.
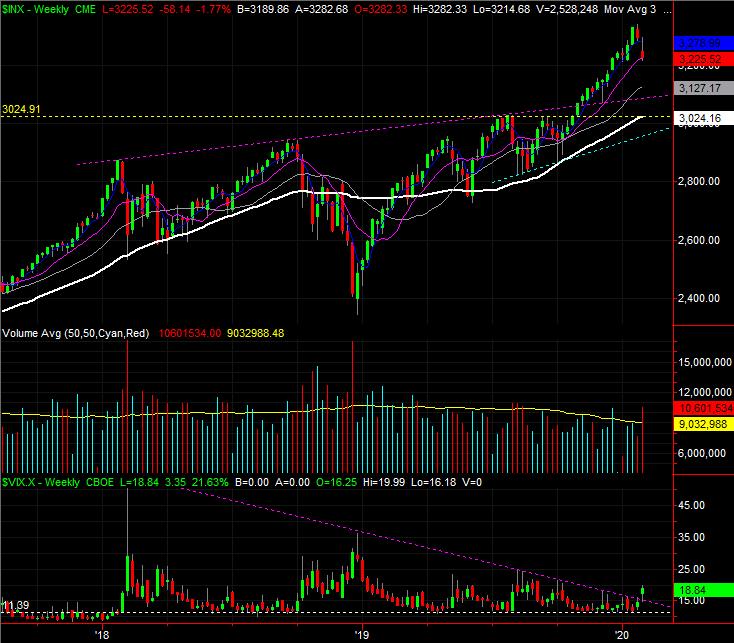
As evident as this may be on the daily chart, the scope of all these clues is even more evident on the weekly chart. It's in this timeframe we can see just how out of character the rally since October has been, especially given how much it added to the rally between late-December of 2018 and the middle of last year. The S&P 500 is now/still up 37% for the past thirteen months, which makes it tough to tack on straightaway gains regardless of the economic backdrop.
S&P 500 Weekly Chart, with VIX and Volume
Source: TradeStation
And the volume matter isn't just circumstantial either. The NYSE's bullish volume has been measurably trending lower since late last year, even though the market itself drifted higher well into January. The NYSE's bearish volume perked up a couple of weeks ago when the S&P 500 finally started to struggle, but was already starting to explode even before last week. Last week's rough patches drew out lots of selling volume, but it wasn't a particularly tough feat to accomplish. The sellers were already headed for the exits en masse.
S&P 500 vs. NYSE Up/Down Volume and Advancers/Decliners
Source: TradeStation
The NYSE's daily advancers and decliners, by the way, have also been leaning in a bearish direction for over a month now. The undertow has been shifting bearishly for a while. It was only a matter of time before the market gave in to that undertow.
Assuming further downside is the shape of things to come (given the bearish volume, the VIX, the break below the 20-day moving average line), it's up to the bulls now to prove they're even capable of taking charge again. The support offered by the S&P 500's 50-day moving average line at 3212 will also need to be broken, and there's a good chance the sellers may take a step back first before making the attempt again. To that end,
until and unless the S&P 500 pulls under its 50-day moving average line, don't jump to conclusions. In the same vein, don't mistake a slight -- or even a significant -- rebound effort as evidence of a prolonged recovery. It could fade quickly.
The one thing not to take your eyes off of as we navigate the current waters.... the VIX. If it races to an extreme high, that could end any pullback quickly enough. Pacing, as always, will be the key, but the sellers haven't been good at pacing in a long, long while.