Weekly Market Outlook - A Reminder That We're Always One Headline Away From Trouble
It coulda been worse, but it certainly coulda been better too. The market ended up logging a pretty nice gain last week, but it gave up much of what it had gained earlier in the week, and ended things on a low note. Most of the indices also ended the week on a technical fence, making the start of this week something of a coin toss.
As always, we'll take a detailed look at this matter below. Also as always, we'll first run down last week's economic announcements and preview what's in store for this week. This past week's biggie, of course, was September's jobs report... news that ended up getting buried by headlines regarding President Trump's coronavirus infection.
Economic Data Analysis
What a week! The grand finale was of course the employment report, but there was plenty earlier in the week worth a closer look.
Case in point: Sentiment. Last week we got the first and only look at the Conference Board's measure of consumer confidence for the month, and we also got the third and final look at the University of Michigan Sentiment score. Both were up, with the former soaring from 86.3 to an incredible print of 101.8, and the latter jumped to 80.4. Each remains well under pre-COVID levels, but those are the highest readings from either measure in months. Consumers seem to be seeing and sensing better days (despite political tensions).
Consumer Sentiment Charts
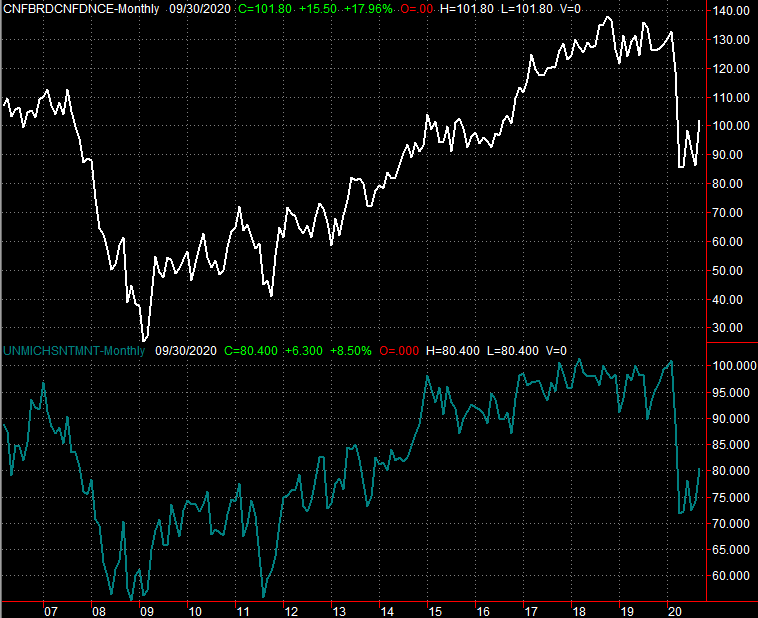
Source: Conference Board, University of Michigan, TradeStation
In this vein, consumers not only continue to buy homes, but pay firm prices for them. The July reading of the Case=Shiller Home Price Index improved 3.9% year over year, mirroring the previous week's update of the FHFA Housing Price Index.
FHFA and Case-Shiller Housing Price Index Chart

Source: FHFA, Standard & Poor's, TradeStation
Both of these data sets are one to two months behind, but that's actually more encouraging. The environment is healthier now than it was in July.
We also got the first of two key ISM Index readings last week... the ISM Manufacturing Index. It fell a little, from 56.0 to 55.4. As long as it remains above the critical 50 level though, it's technically in positive territory.
ISM Manufacturing, Services Index Charts
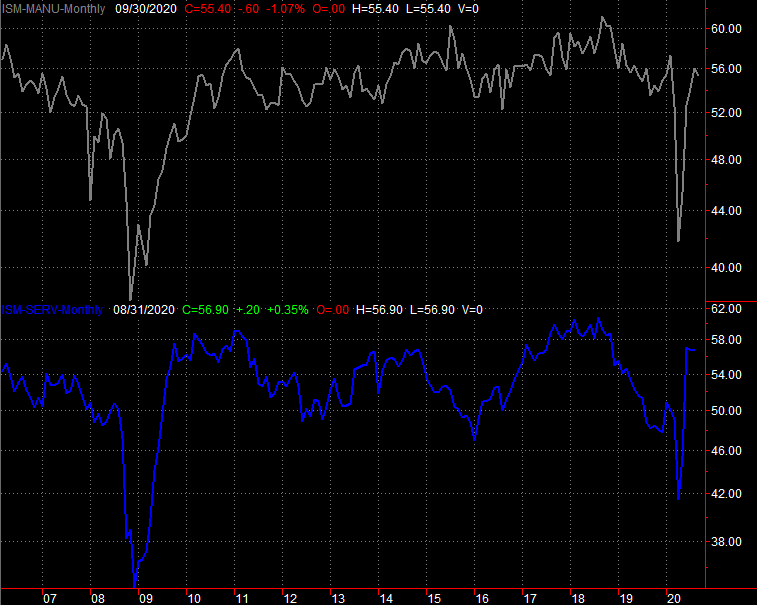
Source: Institute of Supply Management, TradeStation
The ISM Services Index report for September is due this week.
Finally, the September jobs report was unveiled on Friday. The knee-jerk interpretation of it was pessimistic, as the pace of job growth fell from 1.02 million to 877,000 new payrolls. Keep things in perspective though. There are logistical, COVID-related matters in play here, and everybody's only guessing as to how the country climbs out of this hole. It's also worth noting the unemployment rate dropped significantly more than anticipated, falling from 8.4% t0 7.9%, suggesting we may be otherwise understating the amount of progress actually being made here.
Unemployment Rate, Payroll Growth Charts
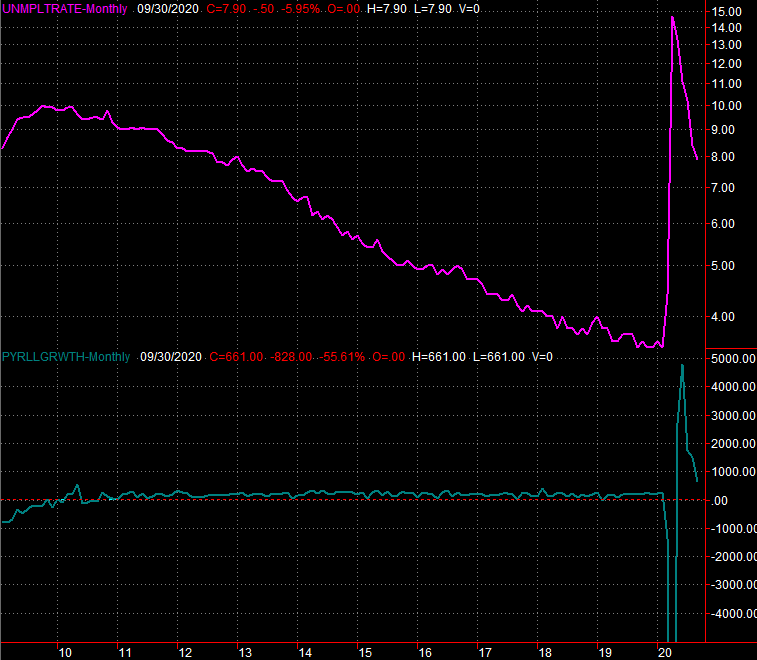
Source: Department of Labor, TradeStation
Everything else is on the grid.
Economic Calendar
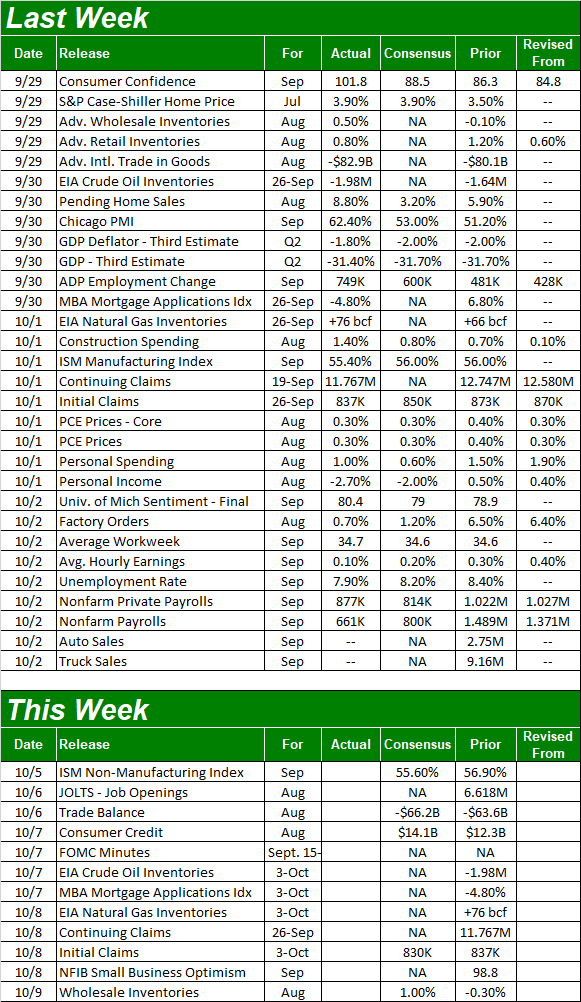
Source: Briefing.com
This week won't be nearly as busy. The only item of real interest will be the ISM Services Index - which should still be strong - and Wednesday's release of the minutes from the most recent Federal Reserve governors' meeting. In short, it should provide a glimpse into how the FOMC is viewing the current situation. Tuesday's job-openings report will be interesting, but in that it's for August as the labor market is in a very unusual situation right now, we're not putting too much weight into what it might imply.
Stock Market Index Analysis
After finally mustering a move above its 20-day (blue) and 50-day (purple) on Thursday, headlines on Friday wrecked the effort. The close of 3348.44 was back below the 50-day moving average, and though that's still above the 20-day average line, Friday's low of 3323.69 briefly broke that floor too. You'll also notice the 50-day moving average line may have been acting as resistance on Friday, regardless of the headlines.
S&P 500 Daily Chart, with VIX and Volume
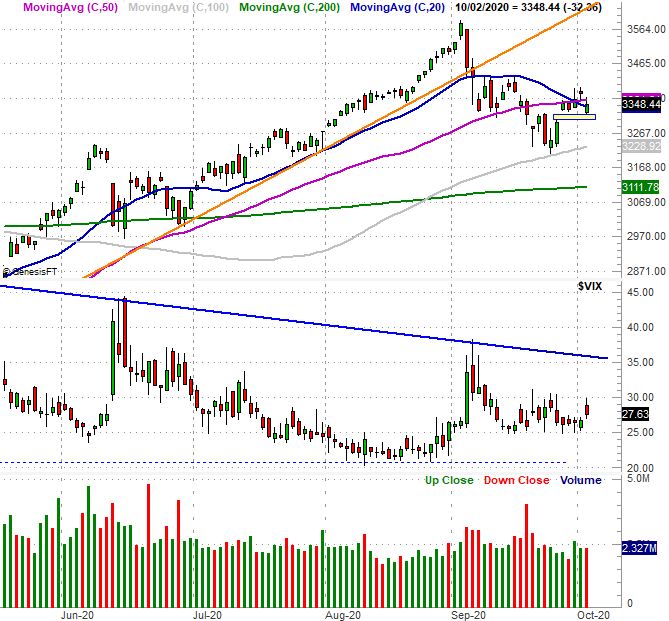
Source: TradeNavigator
You'll also notice there's still an unfilled gap below the S&P 500's current position, left behind with last Monday's opening gap (highlighted in yellow). That's beckoning the index lower.
The same basic situation applies to the NASDAQ Composite...sort of. The composite is still above its 20-day moving average line (blue), but resting right at its 50-day line (purple) at 11,075. It looks like the NASDAQ is finding support, however, where the S&P 500 is bumping into resistance.
NASDAQ Composite Daily Chart, with VXN, Up and Down Volume
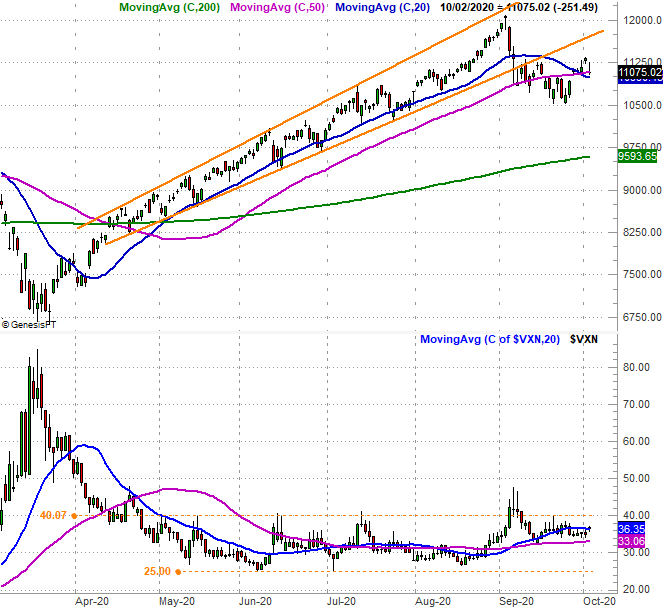
Source: TradeNavigator
The NASDAQ's daily chart hints at something else worth noting - its Volatility Index, or VXN. Though it's not yet in a new uptrend, and objective look at it suggests it's trying to start trending higher. We're seeing higher lows, and have been since June. The key is the VXN moving above its important technical ceiling at 40, where it's peaked a few times since May. It's also clear that this potential test is taking shape at a point after the composite has fallen under the rising support line that's lifted it since April. It took a big jolt in early September to get that ball rolling, but how it starts isn't important. What's important is that once the leak starts, it's tough to plug it up. Another dip under the 50-day and 20-day moving average lines won't be as easily stopped and reversed.
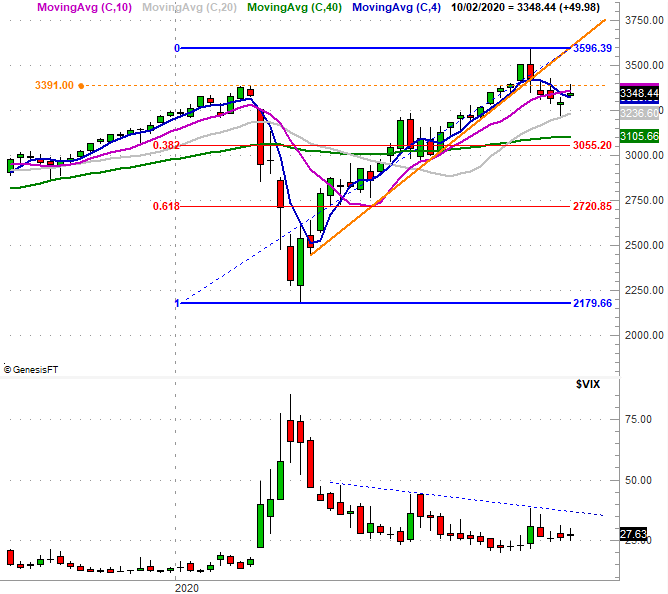
As for how much damage any more selling might inflict, we've got several prospective floors ahead. All of them are near one another, and all are more evident with a weekly chart of the S&P 500. Those downside targets are the 200-day moving average line (green), or a 38.2% Fibonacci retracement to 3055. That 3055 area is where the index bumped into a lot of turbulence and consolidation in June.
S&P 500 Weekly Chart, with VIX
Source: TradeNavigator
A downside move to either of those floors would likely coincide with the S&P 500's Volatility Index - the VIX - bumping into the ceiling it's been dealing with since April, plotted as a blue dashed line on the chart above. If the VIX punches through its ceiling and/or the S&P 500 breaks below its lower floor at 3055, there's a good likelihood of a much bigger wave of selling. Working against that prospect is the calendar. While October tends to start on the wrong foot, it also tends to end on a bullish foot leading into a similarly bullish November and December.
As we said last week, the waiting is the hardest part.