Weekly Market Outlook - A Make-or-Break Week for Stocks Lies Ahead
How long does it take to remind investors that stocks don't go up indefinitely? A week (or less).
 Catching some traders off guard despite some impressive earnings reports, the S&P 500 lost 3.5% of its value last week. It remains to be seen if this is the beginning of a long-overdue correction. It's worth noting, however, that this is what the beginning of a more serious correction would look like... a sharp selloff for no particular reason right after what looks like an accelerated buy-in, also for no particular reason. The likelihood of rising interest rates got the blame, but that looks and feels like a flimsy excuse.
OK, there's political factors at work here as well. That's nothing new though, and for the first time in a long time traders are legitimately starting to doubt the upside and actually expect downside.
Maybe it was just a bad week, or maybe it was more. We'll weight it all after a run-down of last week's and this week's economic news.
Economic Data
Last week was, to put it mildly, amazingly busy. We'll only be able to look at the highlights. In the most logical order (which is anything but in order of appearance)...
It should come as no real surprise that consumers are feeling good right now. The stock market is still buzzing from the record highs it recently hit, and jobs are plentiful -- and good paying. Still, in that confidence inspires consumerism which in turn inspires more confidence, near-multi-year highs from the Conference Board's and the University of Michigan's sentiment scores put a big exclamation point on the current environment.
Consumer Sentiment Charts
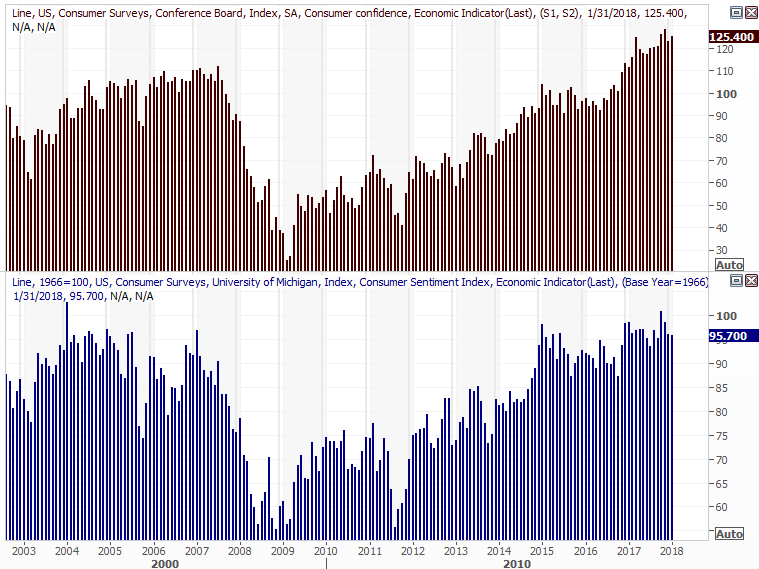
Source: Thomson Reuters Eikon
We cautioned traders a week ago that the post-hurricane surge that was driving the sale of new vehicles was abating. We got more evidence of that idea on Thursday. January's truck and passenger car sales once again peeled back.
Auto Sales Charts

Source: Thomson Reuters Eikon
Last week's show-stopper, of course, was Friday's employment report. Though the unemployment rate didn't budge from 4.1%, the 200,000 new jobs created last month was better than the expected 180,000. Better yet, though it's not shown on our chart, wages grew the expected 0.3%.
Payroll Growth and Unemployment Rate Charts
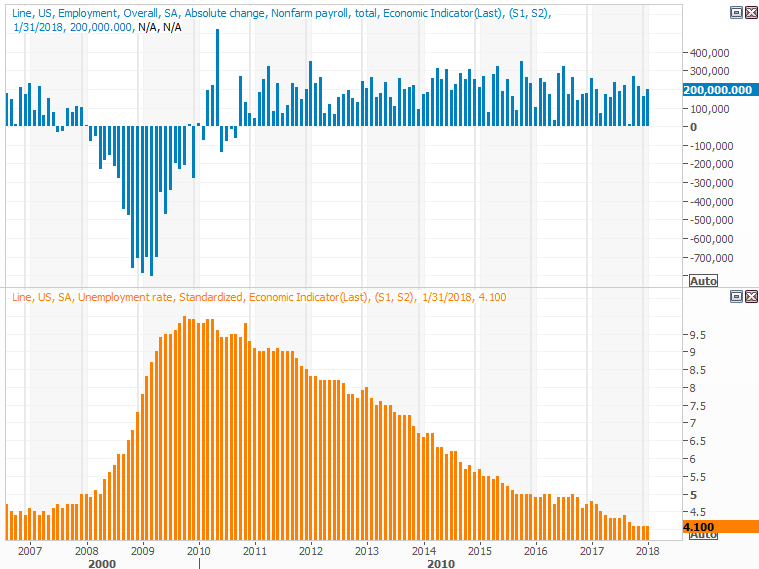
Source: Thomson Reuters Eikon
Everything else is on the grid, or plotted on the preview charts below.
Economic Calendar
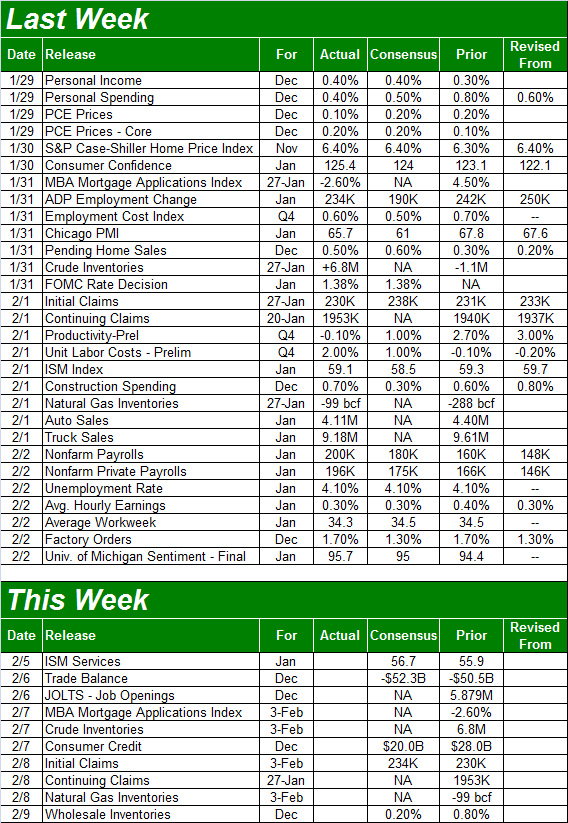
Source: Briefing.com
This week is going to be quite light in terms of quantity of economic data in the queue. But, we're going to be hearing a couple pieces of information that round out some of the data we heard last week. Namely, look for the ISM Services Index score on Monday, following last week's ISM Manufacturing Index reading. The former was down just a hair from December's 59.3, falling to 59.1. The latter is expected to rise from 55.9 to 56.7. Either way, each remains above the critical 50 level.
ISM Index Charts
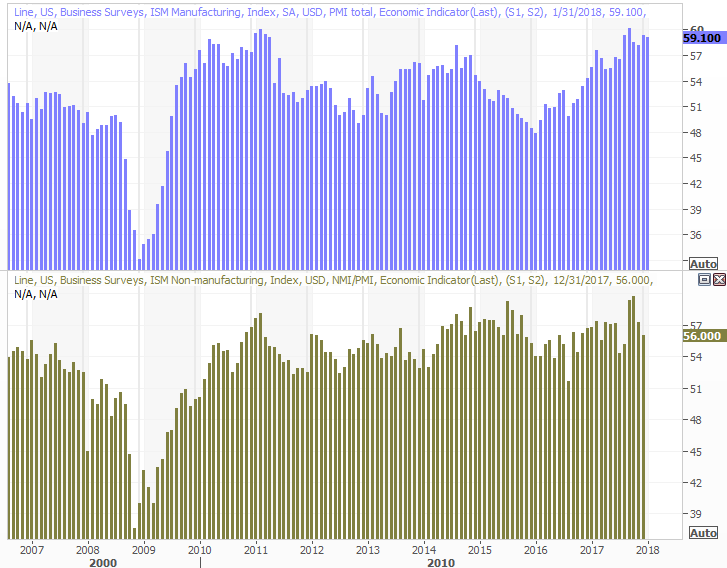
Source: Thomson Reuters Eikon
We're also going to hear about crude oil inventory levels, which for the first time in weeks actually increased a week earlier. It was only a 6.8 million barrel rise, so it's hardly a game-changer. It looks more like a leveling off of an imbalance. Even if it levels off at present levels though, that's still a smaller stockpile than the average we've seen for the past couple of years.
Crude Oil, Natural Gas Inventory Charts
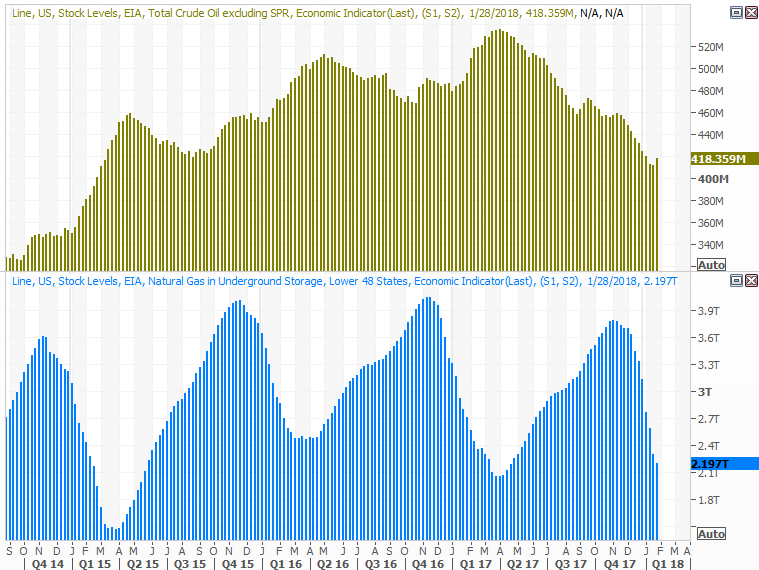
Source: Thomson Reuters Eikon
This has the potential to help pressure oil prices lower, if we see another increase, or even just don't see a drastic decrease in stockpiles this week.
Index Analysis
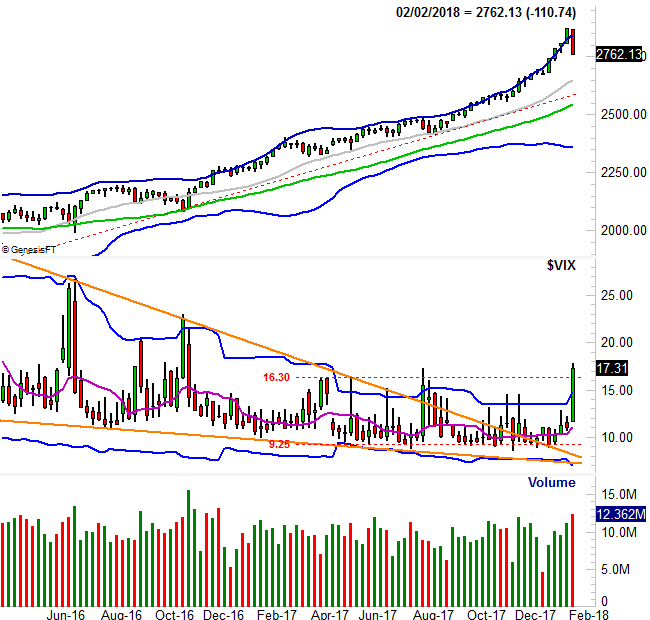
We have to start this week's analysis out with a look at the weekly chart of the S&P 500, just to put some things in perspective. And what a week? It was the biggest single-week tumble since June of 2016, when Brexit was voted to begin. It was the kind of blow that can change the direction of an otherwise-persistent rally.
S&P 500 Weekly Chart, with VIX and Volume
Source: TradeNavigator
The question is, will the pullback serve as the beginning of a much-needed correction. Answer: Nobody really knows.
If we're being 100% honest here, the unprecedented (and uninterrupted) pace of gains seen November of 2016 was built on hope and speculation, and the fear of missing out.... often abbreviated of FOMO. That's fine. Indeed, maybe that's the way it should be. That kind of rally invites equally big profit-taking though. This may well be the beginning of a selloff stemming from overzealous bullishness.
Or, maybe it won't. We really won't know until we see how investors respond to the pullback. They may well brush it off, getting back in the same bullish mood they've talked themselves into being in for the past several months.
There are some things that are different now, however, that suggest the underlying mood has changed for the worst. Namely, the VIX has surged to highs not seen since late-2016.
We've seen VIX spikes before. Most of the recent ones end up marking short-term lows for the market, and became buying points. That may well be in the cards this time around too. Given the sheer depth of the ACTUAL selling and the pessimism indicated by the VIX's surge, however, we can't blindly make such an assumption.
Again, it's not last week's selloff that's damning. It will be the way traders respond to the selloff...
... and we may not really know what that ultimate response is until we get a few days into the week. An immediate bullish pushback isn't a sure sign that the rally is back underway, nor is follow-through on the selloff a concrete sign that this is "the correction." The thing to watch will be how convicted the traders are making those moves. Prepare to for a little whiplash.
Just for good measure, here's the daily chart of the S&P 500. It's worth looking at specifically because there several moving average lines here that could become -- and likely will become -- technical floors that bring the end of any selloff that develops.
S&P 500 Daily Chart, with VIX and Volume
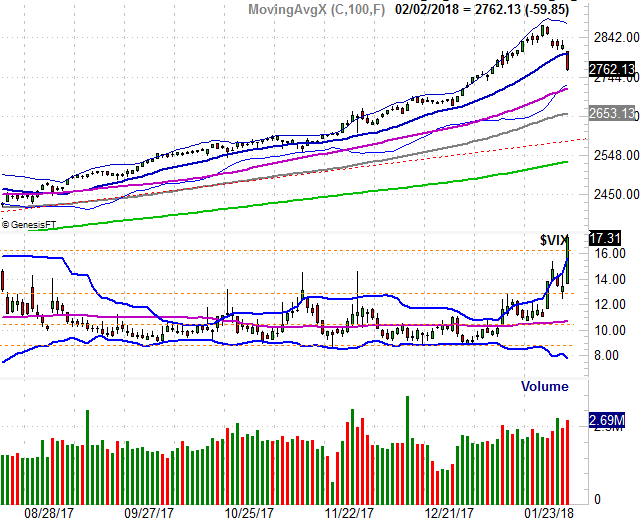
Source: TradeNavigator
This has no become a day-to-day matter. We all innately knew the rally was overextended and couldn't last, but the fear of missing out was strong. We can't tell from the charts above of the fear of missing out is still the prevailing fear, or of the fear of more downside is dominant. It's likely that most traders don't know how they feel yet. It could take a few days for them to figure it out. It might be wise to let that dust settle first. The initial response this week may not be the ultimate direction the market wants to head anyway.