Thursday's Pullback Was a Brutal-But-Underestimated Body Blow

On the surface it doesn't seem like that big of a deal; the market's certainly bounced back from worse. But, Thursday's moderate pullback from the market was actually pretty damaging, laying (much) more groundwork for a more serious correction.
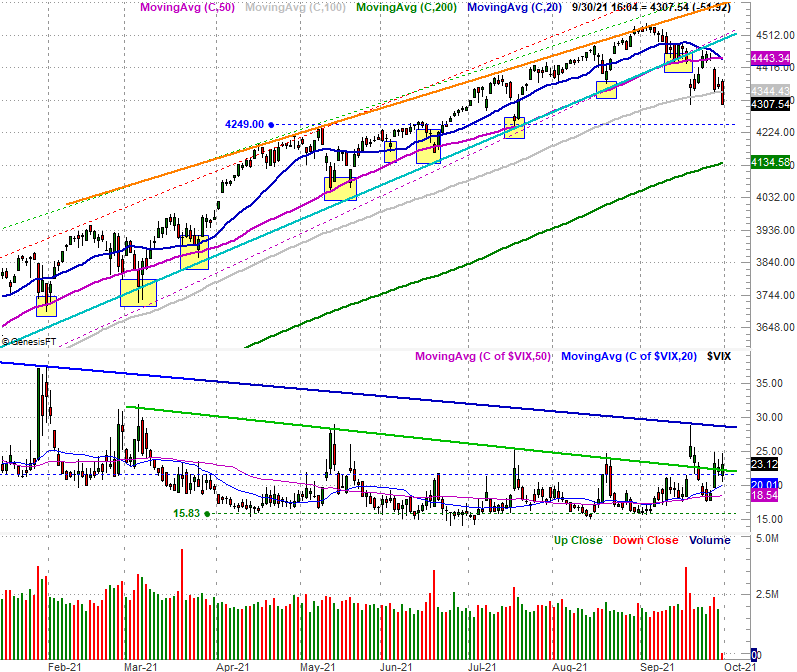
Take the S&P 500 as an example. It toyed with the possibility on Tuesday and Wednesday, but on Thursday it finally broke under the 100-day moving average line (gray) at 4344.4 to end the session at 4307.5. This is the first time the S&P 500's been below this long-term moving average line since October of last year. This setback follows nearly a month's worth of technical resistance at shorter-term moving average lines. In fact, on Thursday the 20-day moving average line (blue) fell below the 50-day moving average line (purple) for the first time since October of last year. Something's clearly changed.
The worry prompted by the S&P 500's stumble is largely muted by the fact that the NASDAQ Composite didn't fall nearly as much. It's a nuance worth noting since the NASDAQ tends to lead the overall market higher as well as lower. If it's holding up reasonably well.
Except, even the composite's modest 0.44% selloff was enough to also pull it under its 100-day moving average line (gray, at 14,484) for the first time since May. This week's weakness has also pulled the NASDAQ under straight-line support (dashed) that connects all the way back to June of last year.
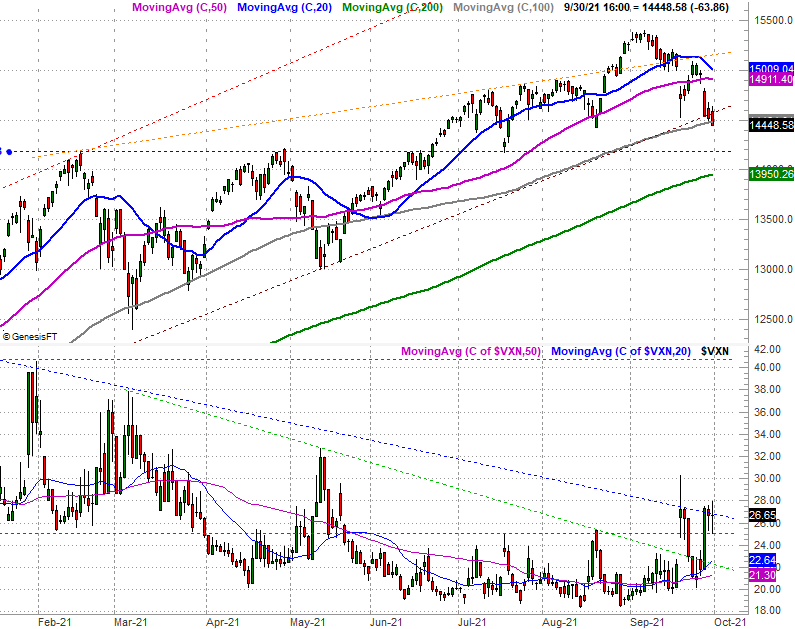
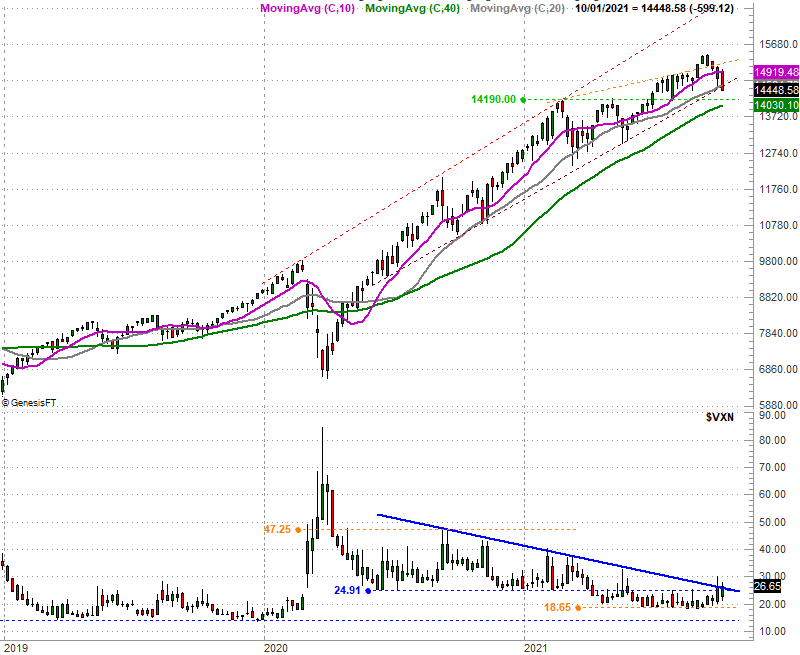
You can also see the NASDAQ Composite's Volatility Index (VXN) is starting to poke through its falling resistance line that's been pushing it lower since September of last year; the weekly chart below makes this clearer.
Again, something's changing for the worse in a way we've not seen in a long, long while.
To the extent it matters, the Dow broke below its 100-day moving average line two weeks ago, also for the first time since October of last year.
Perhaps the most alarming part about Thursday's selling is that it wasn't harrowing or huge. It was sizable to be sure, but it's not the sort of loss that invites immediate buying from the value-minded, buy-on-any-dip crowd. It's possible we can see a small bullish pushback on Friday, but with the NASDAQ's modest loss most traders are likely to take a wait-and-see approach. That will give the pullback another day to build momentum that nobody may choose to step in front of.
The key from this point is the volatility indices. The NASDAQ's volatility index is on the verge of a breakout, but the S&P 500's isn't... at least not yet. It's inching that way though. If the VIX breaks above that falling ceiling (blue) at 28.6 and the S&P 500 continues to implode, that's apt to be the beginning of something bigger. We'll talk about downside targets when that matters more, though for perspective, a 10% correction from the high would put the S&P 500 at 4091, while a 20% tumble puts the index at 3637.
Again, we'll have that detailed discussion if and when it matters.