Thursday's Not-So-Bad Action Actually, Quietly Pushed the Indices to Their Brink

Things don't look too bad on the surface. The S&P 500 fell 0.1%, while the NASDAQ Composite slid 0.13%. As was noted on Wednesday, the market is still above key technical lines in the sand, and there's still a little room to give.
Even with today's intraday bounce, however, the market is closer to a breaking point than the bulls would care to see.
Kicking things off, take a look at the daily chart of the NASDAQ Composite. The close of 15,080 is still above the rising support line (orange) that connects all the key lows going back to March. But, for a brief time the index traded below that mark. The bears are testing exactly where the support is, and how strong it is.
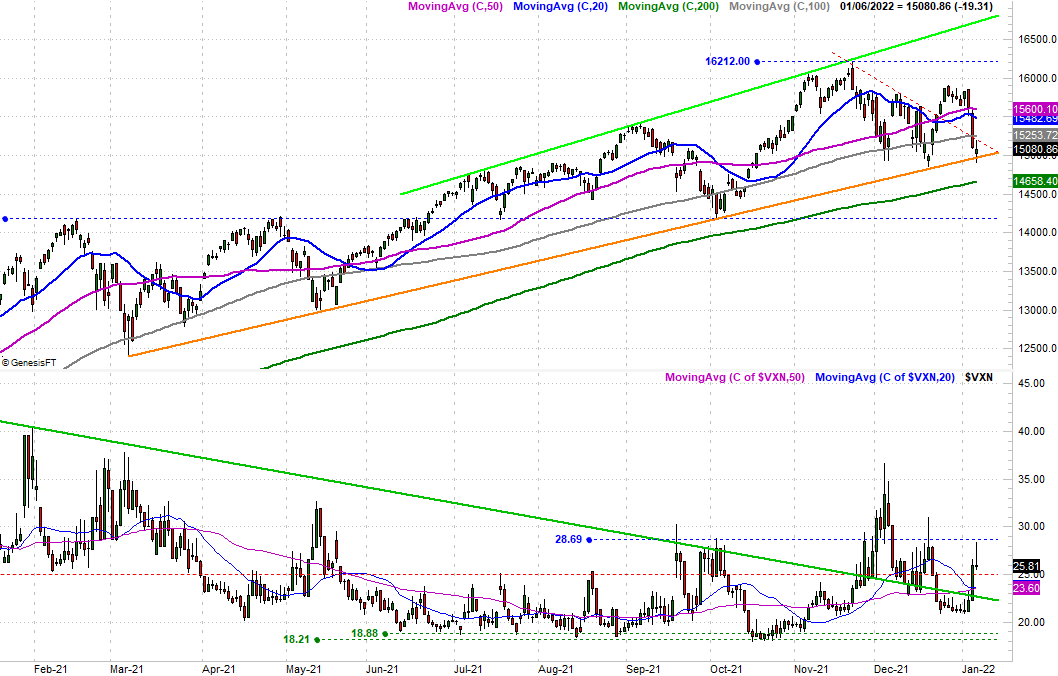
Similarly, the NASDAQ's Volatility Index (VXN) tested its ceiling near 28.7. It didn't move above it. In fact, it peeled back from that resistance to close at 25.8. The test of that technical resistance in itself, however, is telling.
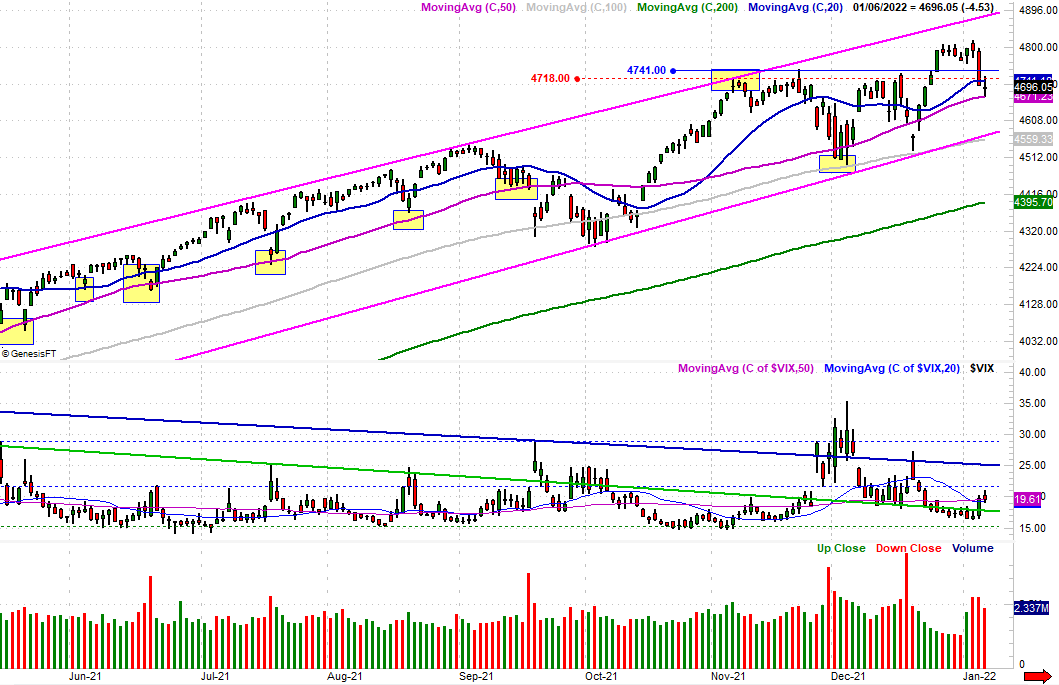
The S&P 500 dished out a similar day, although it isn't in quite the same sort of trouble. The index moved below its 20-day moving average line (blue) at 4711 to end Thursday's trading at 4696. It appears to be finding support at the 50-day moving average (purple) at 4671 though, and the S&P 500's Volatility Index (VIX) barely budged.
It's hardly damning. The shape of Thursday's bars (especially the NASDAQ's) actually leans bullishly. It's a doji, where the open and close are both more or less in the middle of a relatively tall bar... the high-to-low range. This shape loosely suggests a transition, which in this would be a transition from a net-selling to a net-buying environment. The brush of -- and then bounce up and off of -- the composite's longer-term support line underscores the odds that a bullish reversal is in the works; this is exactly where the buyers would make a stand. The flipside is, one more bearish day could do some significant damage to the NASDAQ Composite. Two or three more rough days could pull the composite below its 200-day moving average line (green) at 14,658 for the first time since March of last year. That's a problem.
Meanwhile, the S&P 500's important technical support line at 4570 is moving back within sight. If it fails to hold up as support as well, we'll finally get that long overdue corrective move. The VIX will still need to push above its technical ceiling at 28.0 for any stumble from the S&P 500 to do anything more than it's already done.
Only time will tell if that's where traders are here. They're still pretty confused about what to do with the Fed's more hawkish view of things and renewed growth of the COVID-19 pandemic.