Thursday's Implosion Puts Exclamation Point on Days of Bearishness
Ouch! On Thursday, the market logged its biggest daily loss since May, with the S&P 500 falling 1.5%, and reaching the lowest low since early July.
Thing is, it may have even been worse than it seemed. Also, truth be told, Thursday's implosion has been brewing for a while, and now that a meltdown like Thursday's was allowed to materialize, months' worth of pent-up selling potential could be unleashed.
And make no mistake... all signs presently point to more bearishness, as the undertow pushing things in that direction has been developing for quite a while now.
The scariest part about Thursday's drubbing wasn't the size of the setback. While it was harrowing, what was most alarming is how much participation it had. The selling volume for NYSE stocks yesterday was the second-highest day of bearish volume seen since the very beginning of July. It was also a day where the number of NYSE-listed stocks was its second highest since that same early-July day. When you see that much selling interest, something is going on. In that same vein, the fact that the greatest number of decliners and the highest volume of losers on the NYSE in months cam just a week earlier, traders are clearly deciding things aren't looking good.
It wasn't just a couple of decidedly bearish days that wave a red flag though. That's just a small part of the context. Also since early July, the number of NYSE advancers and the amount of daily bullish volume for NYSE names has been steadily dwindling, as has the amount of bullish volume from day to day. Conversely, the number of decliners and the amount of bearish volume has been steadily climbing since then.
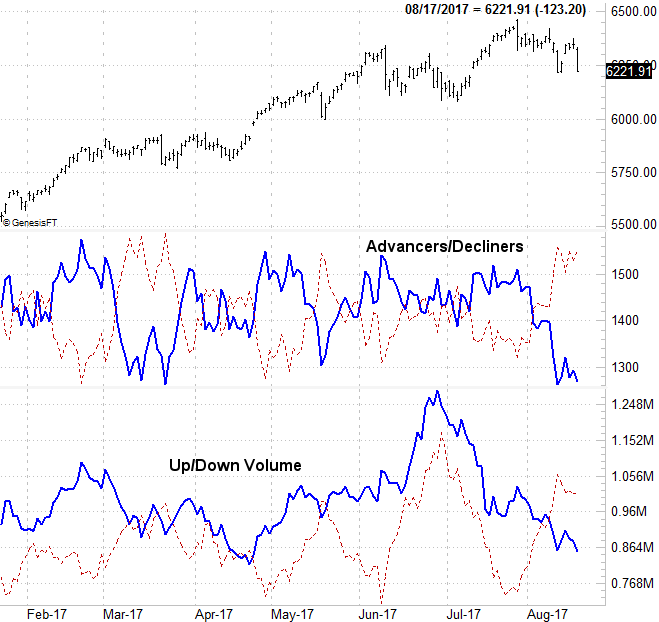
The chart below illustrates the idea; the moving averages overlaid on each data set (ADV = advancers, DECL - decliners, UVOL = bullish volume, DVOL = bearish volume) denotes the direction of the trend for each piece of data. The bearish trend lines are rising, saying they're getting stronger. The bullish trend lines are falling, saying bullishness is weakening. This was happening well before Thursday. In fact, it started to happen well before August 10th, which was the previous day we saw a ton of bearish volume and a great number of falling NYSE stocks.
While the visualization of seemingly-qualitative data tells us a lot, there's more we can do with the information to help is turn qualitative information into very specific and scientific quantitative clues.
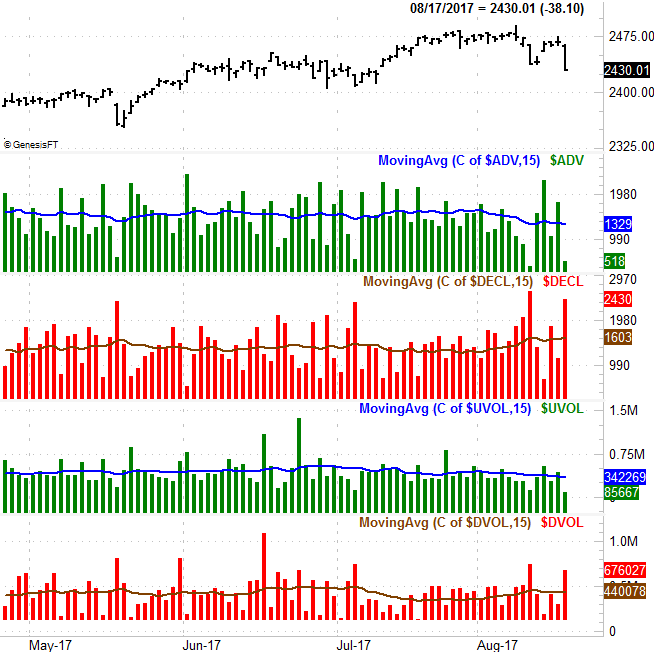
The chart below removes the daily advancer/decliner data, and then overlays the moving averages -- or trend lines -- of the NYSE's advancers and decliners. The thicker blue line still marks the trend for the advancers, while the thinner red line plots the average of the NYSE's decliners from day to day. These lines are the ones in the middle of the chart. Clearly the decliner trend has been outpacing the advancer trend for some time... well before Thursday's or even last week's major stumbles for stocks.
The bottom of the chart removes the daily up-volume and down-volume bars, and overlays the trend lines for both of those data sets. As before, the thicker blue line denotes the bullish volume trend, and the thinner, red dashed line marks the average for the NYSE's daily bearish volume. The bearish trend line become dominant -- by virtue of its move above the bullish trend line -- several days ago.
Point being, the undertow has been bearish for a while.
It's far from a perfect means of spotting new bearish (or bullish) trends. We got several fake-outs in both directions between March and July. On the other hand, this use of the data can keep you out of trouble when things are unclear. At the very least, not being bullish when we got bear signals in early August would have prevent you from being up-ended over the course of the past couple of weeks.
As is the case with most technical trading tools, this data -- and our application -- is only one of several things you should be considering at any given time.
More important right now, all those trend lines still say the undertow is a bearish one. A pullback has to happen sooner or later.