Thursday Could Be the Game-Changer We've Been Waiting On
Against the odds, stocks have soared over the course of the past four trading days. As of Wednesday's close the S&P 500 is up 4.2% from last Thursday's close. The move pushed the index above several important technical ceilings.
But, one more big one remains in place.
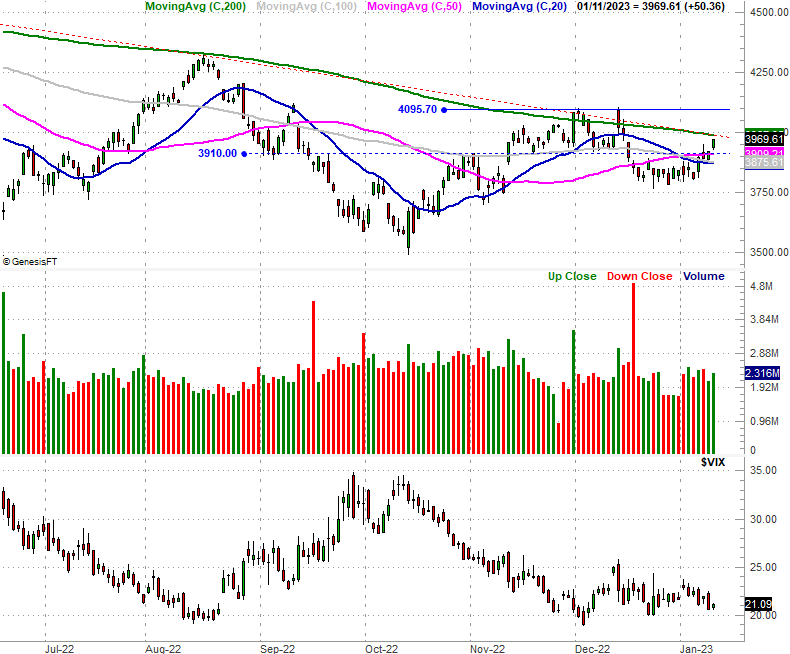
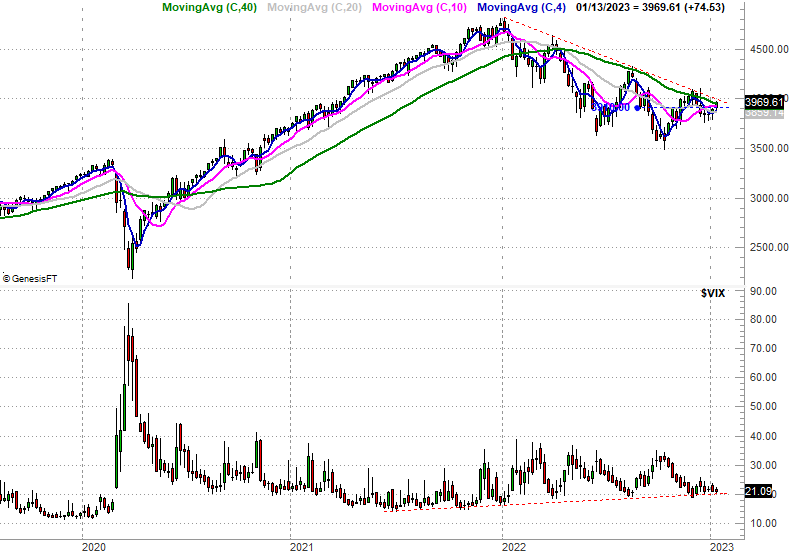
Take a look. The S&P 500 has broken back above its 20 (blue), 50 (purple), and 100 (gray) day moving average lines. The index also broke above a horizontal ceiling around 3910, where it's found support as well as resistance a few times since September. That leaves one last line in the sand to clear, although it's a biggie. That's the 3986 area, where the 200-day moving average line (green) is converged with the falling resistance line (red, dashed) that's been steering the S&P 500 lower since January of last year.
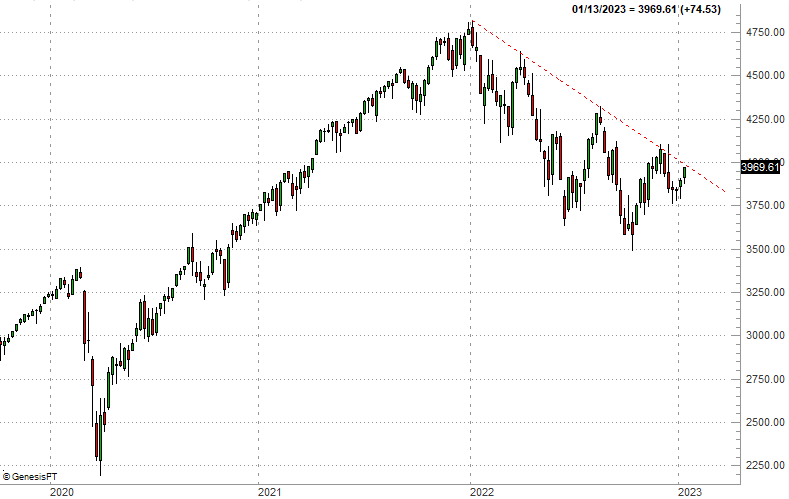
Here's the weekly version of the S&P 500 chart, for a bit of added perspective on that falling resistance line.
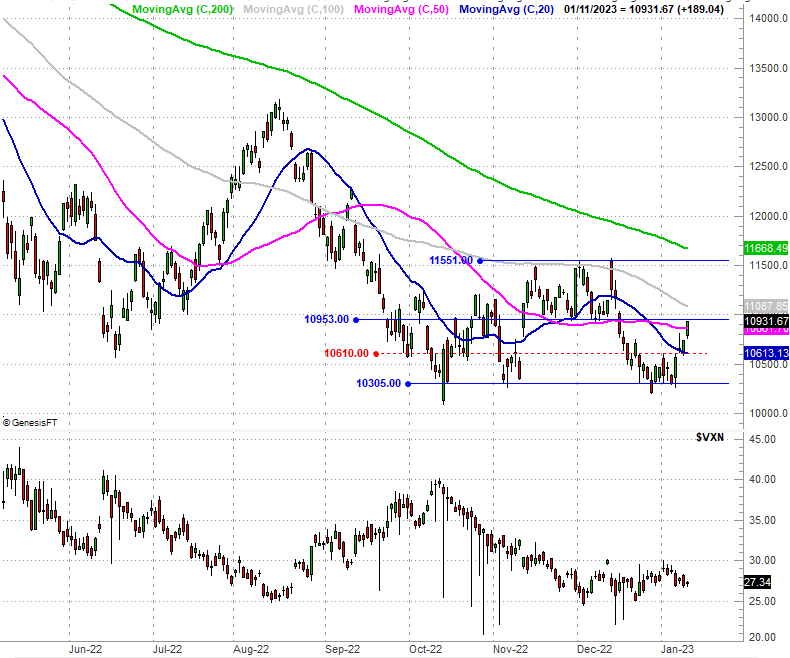
The NASDAQ Composite is doing similarly well. It's made its way back above the 20-day (blue) and 50-day (purple) moving average lines over the past four trading days. It didn't make its way back above a key line in the sand at 10,953 though, and clearly remains below major long-term moving average indicators. Given that the NASDAQ is supposed to lead the way, the NASDAQ's lack of forward progress of late is a bit of a red flag.
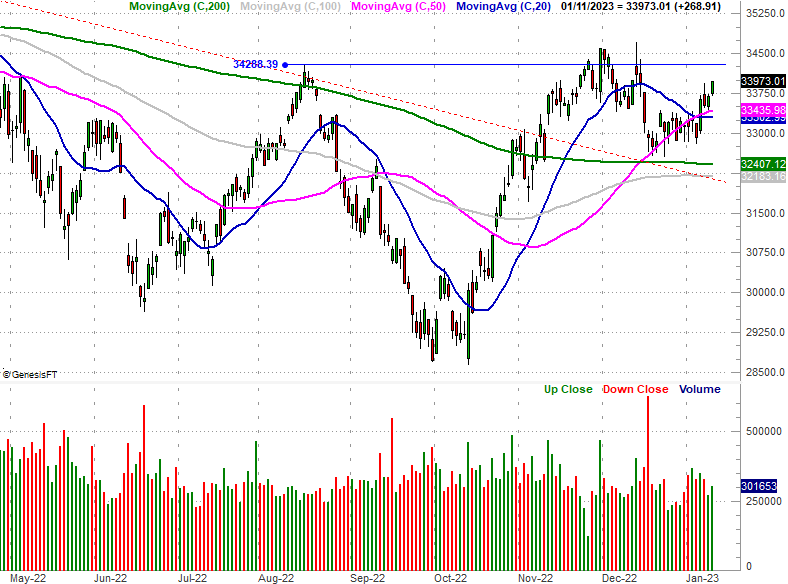
The Dow Jones Industrial Average is doing better than any other index. It's now above all of its key moving average lines, and within striking distance of a key technical ceiling around 34,300.
The situation isn't quite as bullish as it may seem like it is with just a passing glance. The undertow is carrying things higher right now, but headed into Thursday's session, the rally is stalling as the most important moving averages are being approached. (As of late Wednesday, the market's futures are in the red.)
Still, there's enough of a glimmer of hope that the market may be able to build on the recent rally to finally get back into bullish mode. The thing is, it may not be the indexes alone -- or at all -- dropping the final hints to this end.
Take a look at the updated weekly chart of the S&P 500 below. Specifically, take a look at the chart of the volatility index (VIX) on the bottom portion of the image. It's close to breaking under the technical floor that's been propping the volatility index up since the middle of 2021. As you can see, though, the VIX is pressing into that floor now, potentially setting up a break under it. If that happens, that too is bullish for stocks... at least for a while. There's not a whole lot of room below that floor before the volatility index would bump into a more absolute one.
Bottom line? First and foremost don't jump the gun. The market could still easily tumble just as easily as it could finally punch through the aforementioned ceilings. Most of the indices are very much in the middle of major floors and ceilings at this point. You just need to know it -- and see it -- headed into Thursday's session.