
Just when it looked like the market was easing into a full-blown breakout, WHAM! Something up-ends the effort. In this was it was the effective promise of more rate hikes despite Wednesday's 75-point basis hike... the fourth rate hike in as many scheduled opportunities to impose them.
Then again, maybe that was what was going to happen anyway, with or without any help from Fed chairman Jerome Powell.
Don't dismiss the idea. Often times traders have collectively, subconsciously decided where they're going to steer stocks. They just need the prompt to make it happen. The update interest rate plan looks to be the bearish prompt traders were waiting on.
And while things aren't too far gone just yet, stocks are back to the brink of another major round of selling.
But, some other things have to happen first. Namely, the indices need to break under some key technical support levels.
For the S&P 500, that line in the sand is (still) the 20-day moving average line currently at 3731. The index moved above that pivotal line a couple of weeks ago, en route to a move above the 50-day average (purple) and almost the 100-day moving average (gray) at 3898. With just a kiss of that 100-day line though, the index was vulnerable to the selloff we saw on Tuesday turn into a major drubbing on Wednesday. The S&P 500 is still above the 20-day moving average, but clearly within striking distance of it after today.
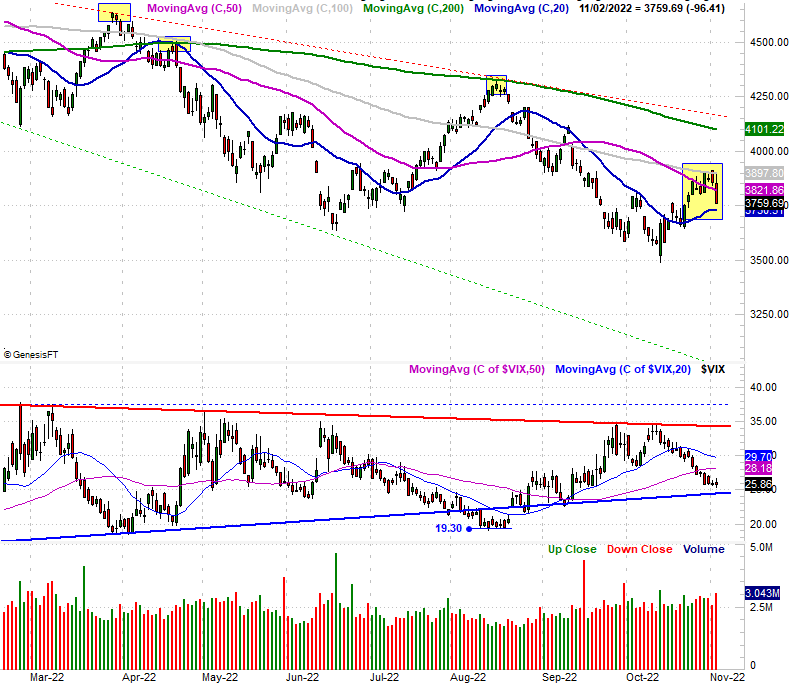
Perhaps the bigger red flag with the S&P 500's daily chart, however, isn't the S&P 500 itself. It's the volatility index, or VIX. It's stopped moving lower, and instead seems to be finding support around 25.70 in preparation for a move higher. Such a move would coincide with the continued breakdown of the S&P 500 that arguably got started on Wednesday.
The NASDAQ Composite, meanwhile, did break under its 20-day moving average line (blue) at 10,755 on Wednesday. It seems to be finding some support at a technical floor around 10,546 again, though, and is still above a major support level around 10,270. After suspiciously bumping into resistance around 11,200 again though, the index is clearly on the defensive here.

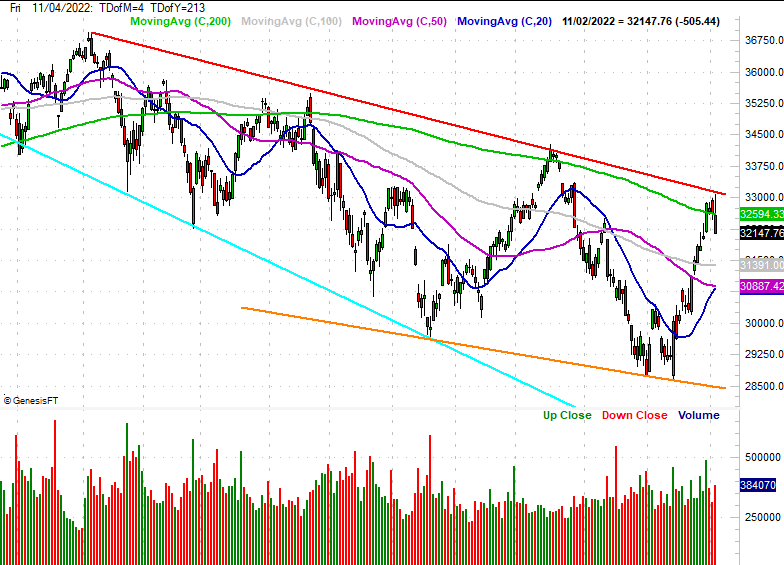
And the Dow Jones Industrial Average is doing its part to kick-start bearishness, even if in a different way. In this case the Dow only had to tease with a small, brief break above its 200-day moving average line (green) at 32,594 and bump into a long-standing straight-line technical resistance (red) at 33,120... a ceiling that's been in play since January. If the pattern repeats itself, look for the Dow to at least peel back to its technical floor currently around 28,460.
One bad day doesn't necessarily mean a new trend is underway. But, all new trends start out with that first rough day that look a lot like Wednesday's. A couple more like it would drag the indices below a couple more key support levels, making a continuation of the selloff much more likely.
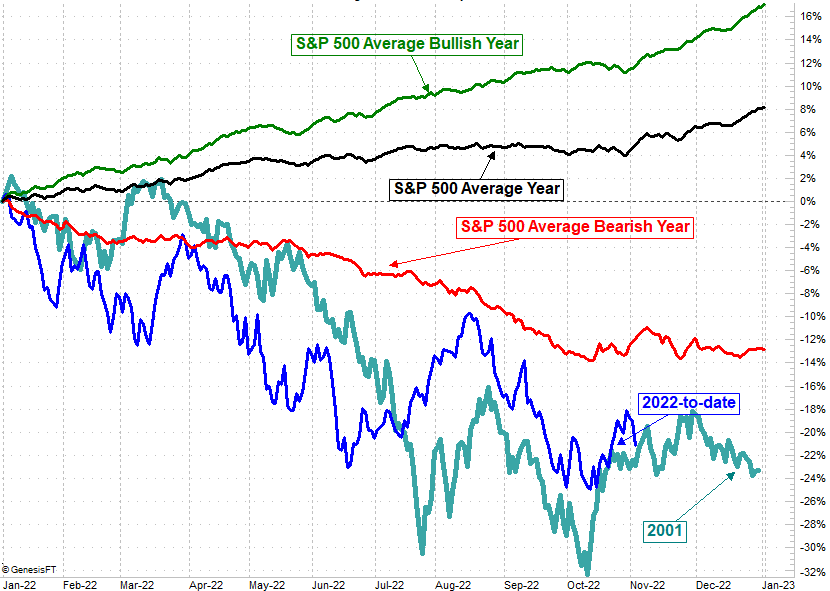
This isn't the sort of action one expects to see this time of year. Usually by this point the usual year-end bullishness is well underway. When it's not underway or in the cards, however, a distinct disparity is unlikely. In other words, when things are bad for a typically-bullish time of year, they're often unusually bad.
In other words, don't dismiss the prospect that the market is due for a rough, bearish end to the year. Indeed, 2022 to-date is looking suspiciously look 2001's day-to-day, cumulative action, which ended on a bit of a bearish low note.
The point is, don't rule anything out. Conversely, don't jump to any immutable conclusions either. We're only exploring all the possibilities here, and laying out how we'll know when the market's beaten down beyond immediate repair.