The Good (and Not So Good) News About This Current Rout
Sure, the Fed's decision to up the Fed Funds Rate by 75 basis points on Wednesday was met with open arms by traders, who pumped stocks up to the tune of 2% in response. It's far too soon to say with any certainty that this is evidence that the selloff is over and we're starting a new uptrend though. After the S&P 500 plunged more than 10% over the course of the previous five trading days, a bounce seemed inevitable no matter what the Federal Reserve decided. It could still easily be a one-day reprieve. In fact, if history is any indication, that's probably all Wednesday's rise was.
Or, maybe not.
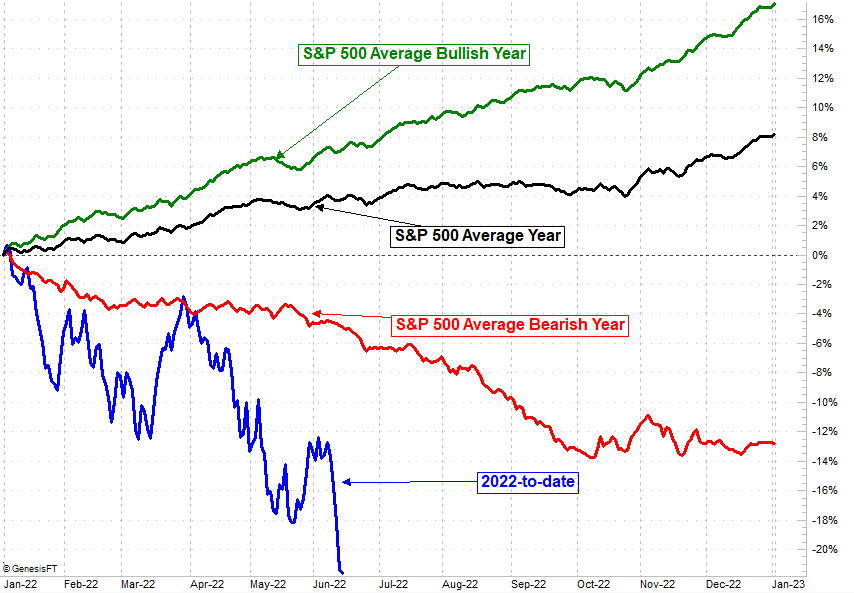
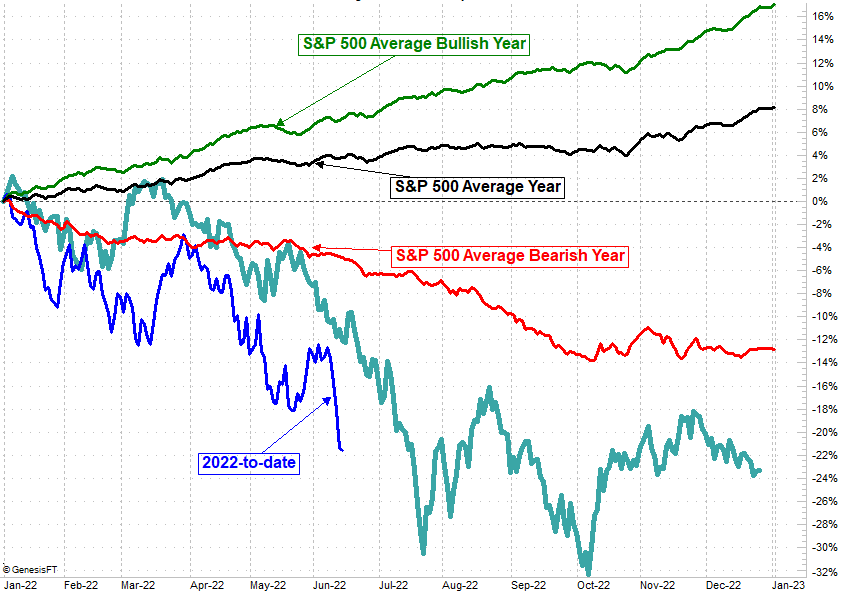
Take a look at the image below, which shows us a great deal of information. The key point of the graphic, though, is to illustrate how dramatically different a year's performance can be and where 2022 stands in comparison to the norm. In a bearish environment, the S&P 500 is usually a poor performer through the end of May, but devolves into an outright disaster beginning in June... extreme weakness that lasts through the end of September. While far more volatile than the norm, there's nothing especially unusual about this action thus far.
Yes, this year looks extreme compared to the average losing year. Take a look at the same chart with one more piece of data plotted on it though... 1962's day-by-day performance path for the index. The S&P 500 is following the same basic trail now that was made then, which didn't hit bottom until late June. It did start to recover then, but didn't completely pull out of the funk until after another hard landing in October.
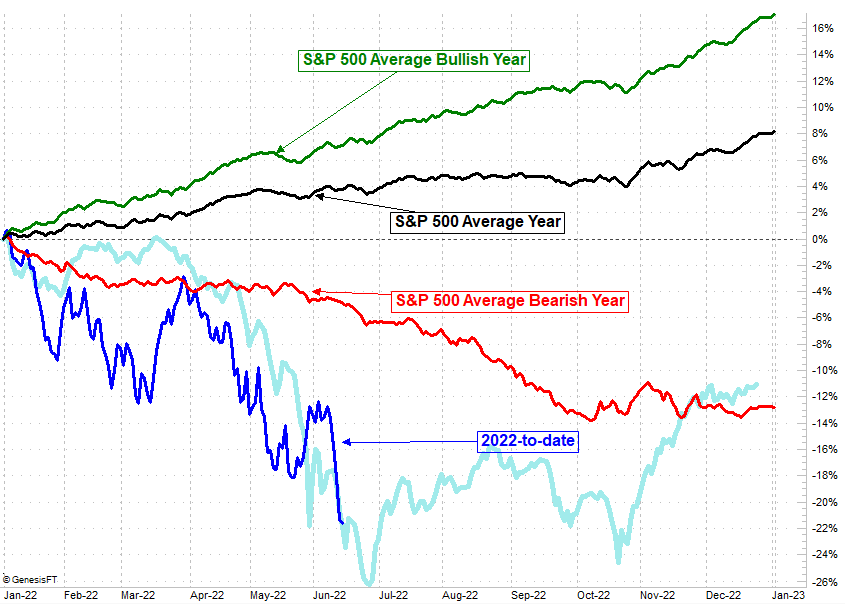
The 1965 rout looks pretty similar to the current one as well, and again, the ultimate bottom wasn't made until October of that year.
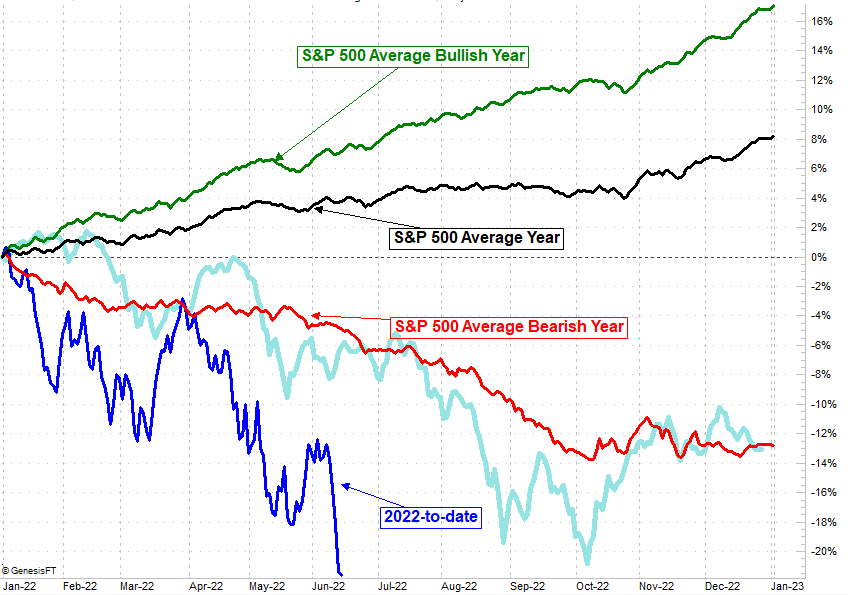
Here's 1973's path for the bear market in place at that time, which not only looks eerily similar to the current action from the S&P 500 this year, but suggests we've actually got a lot farther to go before -- surprise surprise -- the markets hit bottom in early October after a 36% pullback from March's high. [Though not shown, the 1972 day-by-day path looks about the same as 1973's.]
Here's 200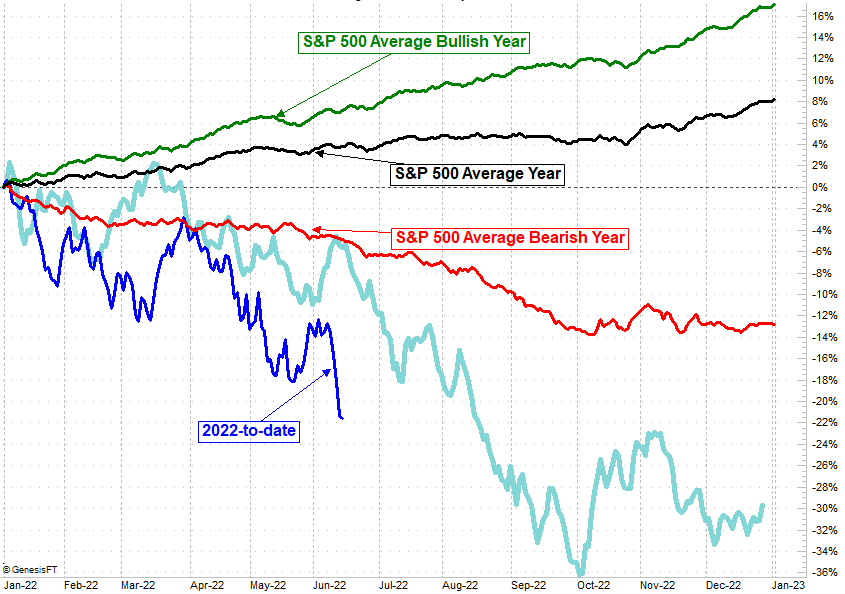 1's action, which not only looks like this year's move, but again shows that these big pullbacks can get much, much bigger through October. Although 2001 ultimately ended the bear market resulting from the dot-com implosion, it didn't hit bottom until the S&P 500 had lost 36% of that March's peak price.
There are two big takeaways here. One is, again, as rough as the past few months have been, we've seen worse, and it's not been unheard for the market to continue taking on losses even when it seems like there's no room left for more downside.
The other big takeaway is, if any month is a "bear market killer", it really is October. And this is where things get interesting.
Be wary of relying too much on the calendar and historical tendencies to make trading decisions. On the other hand, you can't afford to ignore them either; the time of year really can influence which direction the market moves. Corporate and government budgets are made at the same time of year every year. Elections happen at the same time every year. Food crops are grown at the same time every year. Energy usage swells and contracts at the same time every year. So, the calendar can matter.
In any case, what's so interesting is the timeframe between the S&P 500's early-January peak and the likely October low. That's just a little over nine months, perfectly jibing with the fact that the average bear market last 9.6 months.
In a similar vein, in the years 1962, 1965, 1972, and 2001, the average peak-to-trough pullback from the S&P 500 was 36%. At its current trajectory (assuming Wednesday's bullish jolt isn't the beginning of a prolonged rebound), the S&P 500 will have fallen about 36% by that point in time.
In other words, for better or worse, this year's action to-date is shaping up pretty typically. If this holds true, while the next few months could be mostly-bearishly volatile, we should be out of long-term trouble by October.
It can't be stressed enough... this is just statistical data based on historical numbers; the market loves to do the unexpected. Nothing is etched in stone. It's noteworthy data all the same though, if only to remind us what's possible, and what's not unusual.