
It could have been worse. While the S&P 500 ended Tuesday's trading down 0.67%, at one point during the day it was as much as 1.5%. The intraday reversal offers a glimmer of hope that the market may be ready to hammer out a bigger rebound. The bearish gap left behind at the open only bolsters the argument for a recovery; the market doesn't like to leave gaps unfilled. The reversal also happened right where one would expect it to.
Before jumping to a conclusion though, take a step back and consider the alternative read of Tuesday's action. While odds are good we'll see a dead cat bounce, in many ways the bears tipped their hand even if they didn't play their hand.
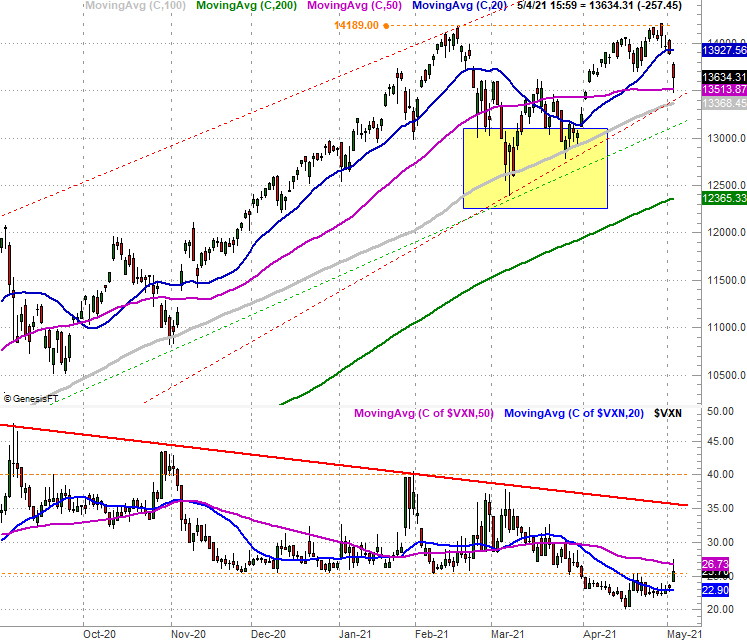
First things first. We're going to zero in on the NASDAQ Composite's chart rather than the S&P 500's, as the composite shows us something else worth stewing on. Just so you know though, the basic premise applies to both indices.
Take a look. The early selloff cut deep, but all it took was a kiss of the NASDAQ's 50-day moving average line (purple) to shift the tide back to bullishness. Also note that while the NASDAQ Composite's Volatility Index - or VXN - punched higher, that surge was stopped at its 50-day moving average line as well.
This is what a turnaround would look like. Don't be too quick to assume that's what's in the cards though.
While this week's weakness thus far already opens the door to a solid bounceback, there's no assurance any bounce will last. The sellers showed us they're willing to take their shots. They didn't control the whole day, but the market's vulnerability was exposed. Most concerning is the fact that the VXN made a pretty firm upward thrust, which indicates a more heartfelt worry that things are starting to unravel here. Volatility Indices are based on option prices, which tend to be an arena that more experienced and bigger traders tend to dabble in. In other words, the smart-money crowd is starting to flinch in ways they haven't.
Again, don't jump to a conclusion.... bullish or bearish. Stocks are beaten-down so bad we're due for at least a small bounce in the latter half of this week. Such a bounce might not go anywhere. Conversely, as long as the NASDAQ's 50-day moving average holds up as a floor, the VXN just might stabilize under its 50-day moving average line. That's bullish.
The one thing we want to watch the most here is what happens if-and-when the 50-day moving average line is tested as a floor, or the VXN tests its 50-day moving average as a technical ceiling. If they're surpassed with the next effort to move past them it will mark a major change of character for the broad market. We're closer to that than we've been in weeks. The fact that we're moving into the heart of a slow time of year only exacerbates this downside risk.