Stocks Trapped Between a Rock and a Hard Place Following Thursday's Action
We've suspected for a while now that investors weren't really as bullish as the quick look at the chart would suggest. Mostly, they're indecisive, not really sure what to expect.
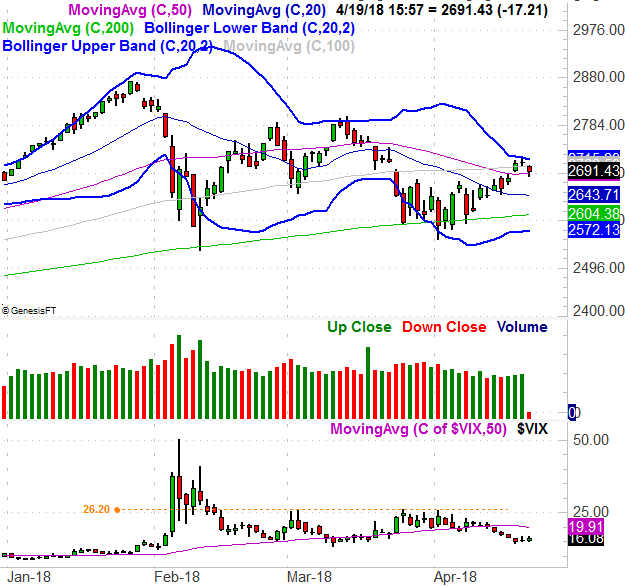
After Thursday's closing bell rang, we know for sure. The S&P 500 topped exactly where we would have expected it to on Wednesday, but with Thursday's loss we can also see the bulls have drawn an important line in the sand right where we'd expect them to.
The daily chart of the S&P 50 below tells the tale. The upper Bollinger band (20-day, blue) halted the uptrend on Wednesday, forcing the pivot. The bears dished it out on Thursday... right up until the 50-day moving average (purple) was going to break, or fail, as a floor. The bulls held the line there though.
It could be worse. At least the indices (this analysis doesn't just apply to the S&P 500) are finding support at a pretty important level. Besides, we'd expect to see some resistance at the upper Bollinger band; stalling there doesn't mean it won't be hurdled. If we're being completely unbiased though, the problem with the market now is the same problem it's had for weeks. That is, there just isn't a whole lot of committed interest in stocks right now.
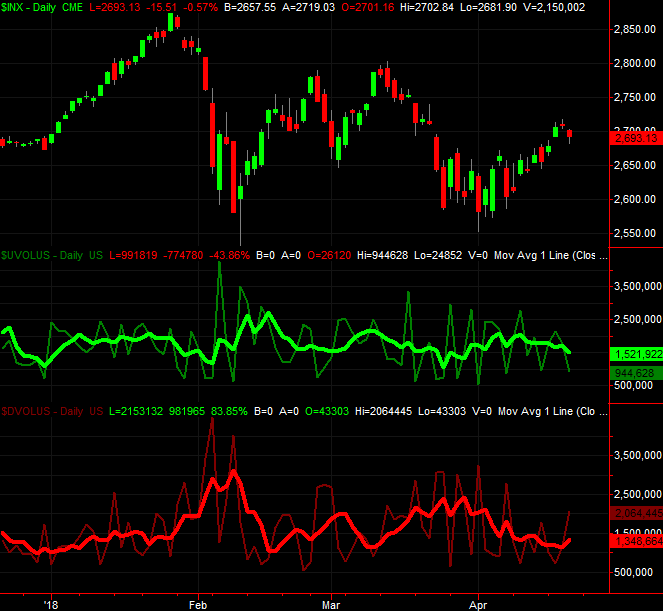
It's a difficult, subjective idea to objectify.... if you don't have the right tools. We do have the right tools though, being able to plot the market's daily "up" volume and "down" volume.
We're not interested in that specific data, however. It's too erratic by itself to analyze. To make better use of it we want to determine the trend of the two data sets. We can do so by applying moving averages of each data set.
That's what you see on the bottom portion of the image below. The thicker, brighter green line is a moving average of the daily "up" volume, while the brighter, thicker red line is a moving average of the market's "down" volume. When smoothed out like this, we can get a good feel for how traders really feel about stocks by figuring out what they're actually doing with their money.
Notice that even though the S&P 500 had continued to rally for the past few days, the "up" volume trend turned lower a week and a half ago. Granted, the "down" volume trend was fading too, but the sellers certainly came out of the woodwork on Thursday during a session that - honestly - wasn't all that bad.
What are traders so afraid of? It's a not-entirely-rhetorical question. The answer is, they have doubts that the market is going to be able to add to its value in the foreseeable future.
You'll hear plenty of excuses. Chief among them is political uncertainty. That's a rather flimsy excuse for the bulls staying on the sidelines though; history shows politics and geopolitical tensions don't really hold the market, or the economy, back.
Concerns about a lackluster earnings season are a slightly better excuse, though still not a bulletproof one. Earnings season is a lot like a Rorschach test. That is to say, investors see what they want to in them. If they want to be bullish, they'll find the good even in the midst of bad earnings reports. Conversely, if they're subconsciously bearish, they'll see the bad in the midst of a good earnings season.
That's the long way of saying you're better off watching charts to see what the market IS doing rather than assuming the market is going to do what you think it SHOULD do.
Right now, the fact that the S&P 500 is trapped between well-established support and resistance lines tells us traders really have no idea what's going on, or what's next. Make no mistake though... the undertow is flowing in a bearish direction.