Perspective on the Pullback: Now's the Absolute Worst Time to Freak Out
You know you've just seen something amazing when observers qualify it as "the first time it's happened since XXX,", and that XXX is a time measurement numbered in years.
To that end, this past week's market meltdown is amazing, as it was the biggest weekly meltdown since 2009. The S&P 500 fell roughly 7% (on a close-to-close basis) last week, and is now down 10% since the peak two weeks ago. At one point earlier this week, though, the index had fallen as much as 12%. It's been painful for a lot of people, including for market veterans who had forgotten than in the grand scheme of things that a 10% correction (or more) is the norm.
The big question now, of course, is what's next? What do investors do? That's the less-direct way of asking whether or not the selloff is done.
The answer is.... probably. Even if we've not seen the ultimate low though, we're near enough to it to start picking out some names that didn't deserve the size of the pullback they just suffered.
It's always dangerous to count on a repeat performance from the market. The truth is though, the market is a relatively predictable beast; people just make it hard by assuming "this time is different." It matters right now just because what we're seeing on the fronts that really matter are things we've seen before at major bottoms.
We're talking first and foremost about the VIX. It surged to multi-year highs of 50 this past week for the first time in a long time. Then it peeled back. Thing is, the VIX has surged than fallen enough times in the past to say we've seen it before. The response from the market was the same every time.
Take a look at the weekly chart of the S&P 500 and the VIX below. Four times (and maybe five if you count the double peak from late-2011) since the 2009 recovery we've seen the VIX surge to 50. All four times the market was at or near a major bottom. We don't think things are different this time around. [Click the chart to see the full-screen image.]
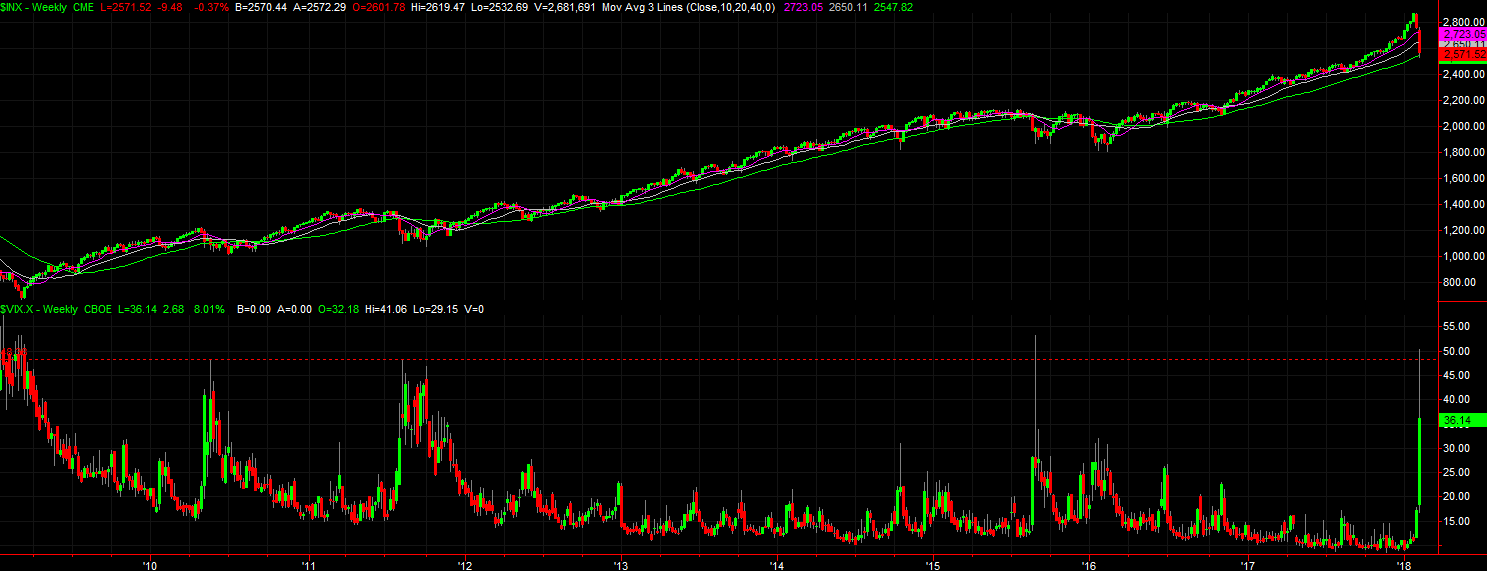
It's absolutely crucial to understand that this is not a laser-precise clue. It could take a couple of weeks for the market to actually regain its footing and continue its climb. The S&P 500 could edge a little lower - and maybe even a lot lower - before rebounding. It appears to be brewing up though, at a point when nobody's even thinking about it. As the old saying goes, buy when there's blood on the streets.
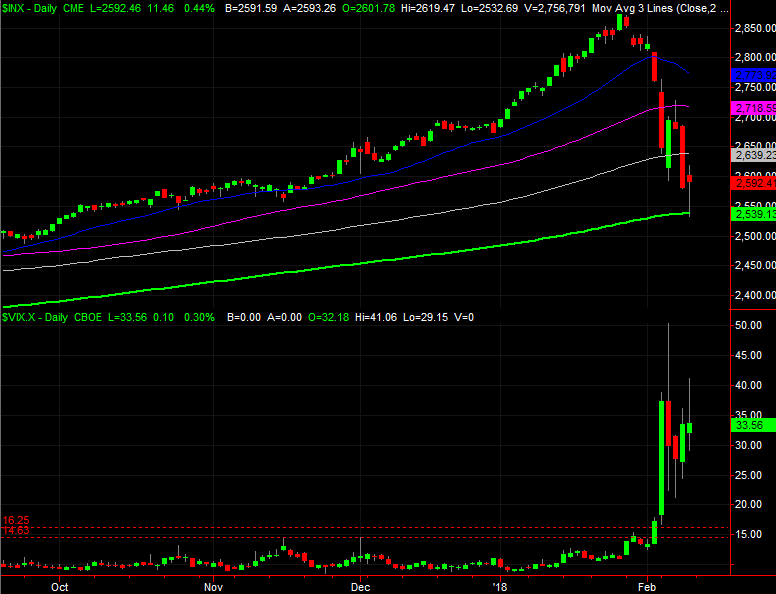
That being said, the VIX's surge isn't the only bullish argument here. Zooming into the daily chart of the S&P 500 we can see that the index has curiously just kissed the 200-day moving average line (green) on Friday and then began to turn things around.
It's a purely psychological result, but that's ok. The selloff was a purely psychological one. The uninterrupted rally since early 2016, for that matter, was purely psychological. These seemingly silly things can and do actually matter.
And for what it's worth, note the shape of Friday's bar. The open and close were both near the high, with a long-tailed intraday low in between that tagged the 200-day line. This hammer-shaped bar is the one you generally see at a major pivot for the market.
To be fair, there's no guarantee a rebound will last as long as the last rally did. There's not even any assurance it will last past April, if it happens at all. Between rising earnings and a tremendous economic headwind though, there's plenty of fodder for the bulls and buyers to get back on the proverbial horse and keep them there indefinitely. The rally since early 2016 wasn't all that likely either, and yet it happened.
The flipside, while we can hope for the best it's still wise to plan for the worst, just in case. To that end, note that the market may want to test traders one more time by driving the S&P 500 below the 200-day moving average line. If that happens, don't be shocked to start seeing people wearing "The End is Near" signs on city sidewalks. Emotionally-shattered traders won't be able to survive another blow to the chin.
As for where the bottom might be found if there's one more leg to this pullback, for the S&P 500 watch the 2464 area. That's a 38.2% Fibonacci retracement of the rally we've seen since early 2016. That low of 1811 isn't just the early 2016 low. It's a meaningful low because it was a low from late 2014 and a minor low from early 2014. There's more than enough about that mark to use it as the starting point for a Fibonacci retracement analysis. [Click the chart to see the full-screen image.]
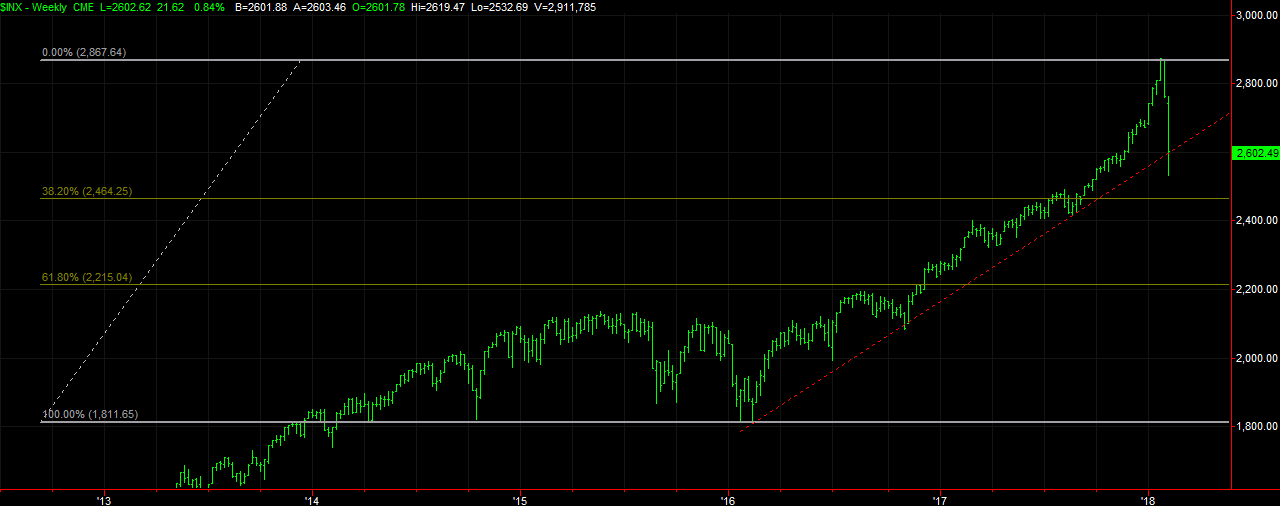
Again though, that retracement is only a possibility here. We bring it up just to make sure you don't panic if the index breaks below the 200-day moving average line. Everyone else will be freaking, but you'll want to view the matter as a buying opportunity.
Either way, we appear to be much closer to a bottom than not.