Opinion: Investors now are greedy, and that’s bearish for stocks
- Market sentiment reflects a significant shift towards irrational exuberance -
From Mark Hulbert, MarketWatch
The mood on Wall Street has shifted from fear to greed. And, like clockwork, contrarian-minded investors have shifted their short-term outlook in precisely the opposite direction, from positive to negative.
To appreciate how big a mood shift has taken place, consider where sentiment stood in early August, which was the last time I devoted a column to a contrarian analysis of sentiment. I reported then that stock-market timers were running for the exits, which in turn gave the bull market “a new lease on life.”
Since then, the S&P 500 has gained close to 3%, taking this U.S. market benchmark to a new bull-market high, surpassing its previous high set in late January.
Today, in contrast, the majority of stock market timers are on the bullish bandwagon, reflecting an underlying enthusiasm if not outright exuberance. That is why contrarians now believe that the market will be heading down.
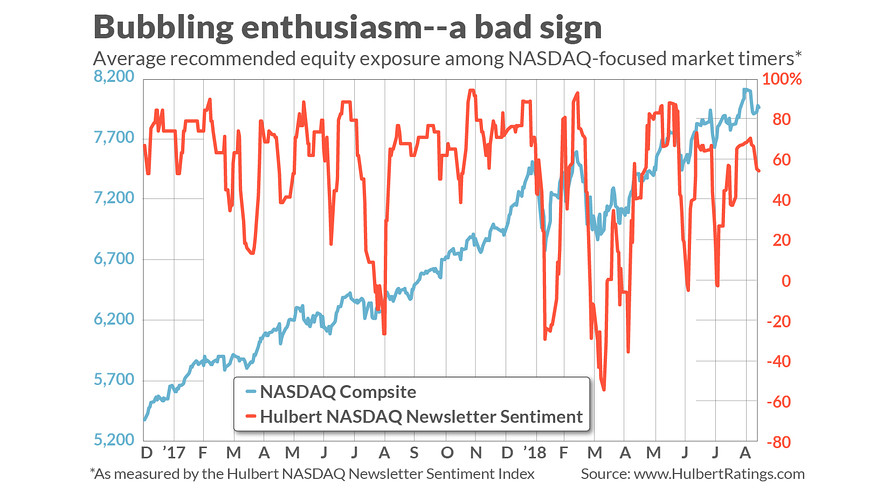
Consider the average recommended equity exposure among a subset of short-term market timers who focus on the Nasdaq market in particular (as measured by the Hulbert Nasdaq Newsletter Sentiment Index, or HNNSI). Since the Nasdaq responds especially quickly to changes in investor mood, and because those timers are themselves quick to shift their recommended exposure levels, the HNNSI is my most sensitive barometer of investor sentiment in the equity market.
This average currently stands at 64.9%, having risen in recent sessions to as high as 70.1%. On the occasion of my early-August column on stock market sentiment, in contrast, this average stood at minus 2.7%. This represents a significant shift towards irrational exuberance.
The current stock market mood is more akin to the ‘slope of hope’ the market descends.
Accordingly, instead of the “wall of worry” that prevailed in early August, the current stock market mood is more akin to the “slope of hope” the market descends.
It’s interesting to note that this 70.1% recent reading is almost identical to the HNNSI level that prevailed on the day of the stock market’s late January high, when the HNNSI closed at 70.6%. The Nasdaq Composite fell almost 10% over the two weeks following its January high, and the S&P 500 lost even more.
To be sure, not every HNNSI reading of 70.1% or above is followed by such a precipitous drop. But more often than not the stock market struggles when the HNNSI is this high, especially in comparison to its performance in the wake of widespread fear.
The usual qualifications apply. Contrarian analysis doesn’t always work, and even when it does it’s only a short-term tool. So market-timer sentiment tells us nothing about the stock market’s likely trend over the intermediate or longer terms. But, to the extent contrarian analysis is right, the stock market over the short-term is likely to head lower.
How short is the short term? In the 1980s and early 1990s, which is how far back my sentiment index data extend, my sentiment indices’ greatest explanatory power was at the three-month horizon. Today, in contrast, as investor reaction time gets quicker and quicker, that horizon is closer to one month.
All of which suggests that the stock market between now and mid-October is likely to be lower than it is today. Plan accordingly.
For more information, including descriptions of the Hulbert Sentiment Indices, go to The Hulbert Financial Digest or email [email protected].
From MarketWatch