No, Tuesday Still Didn't Break the Market's Back... At Least Not Yet

With nothing more than a quick glance at the numbers it would be easy to assume the stock market just slipped over the edge. The S&P 500 tumbled a little more than 2.0% on Tuesday, while the NASDAQ Composite slipped 2.8%. Given the recent weakness from both indices prior to today, Tuesday's steep selloff surely dragged stocks past the point of no return.
Actually, no, it didn't. It was close, but there's still a shot at a rebound, and the odds of a rebound after Tuesday's drubbing are actually now above average as a result of the big setback. It's all in the chart.
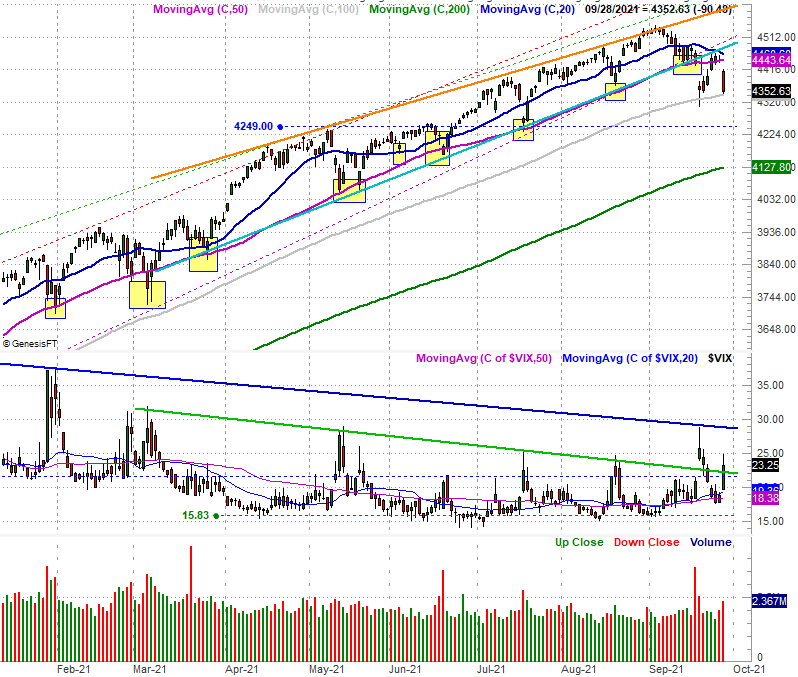
To this end, take a look at the daily chart of the S&P 500 below. The index left behind a bearish gap at the open, and then proceeded to pull back. The selling was stopped cold at the 100-day moving average line (gray). This is the best line in the sand the bulls could have used to make a stand, given their current lack of options.
Here's the daily chart of the NASDAQ Composite. It's in a similar situation. That is, although it didn't quite test its 100-day moving average line (gray), it did touch a technical support line (dashed) at 14,540 that now connects all the key lows going back to the middle of last year. It didn't break under it though, and as was the case with the S&P 500, this is the best possible spot the bulls could have finally stepped up to the plate.
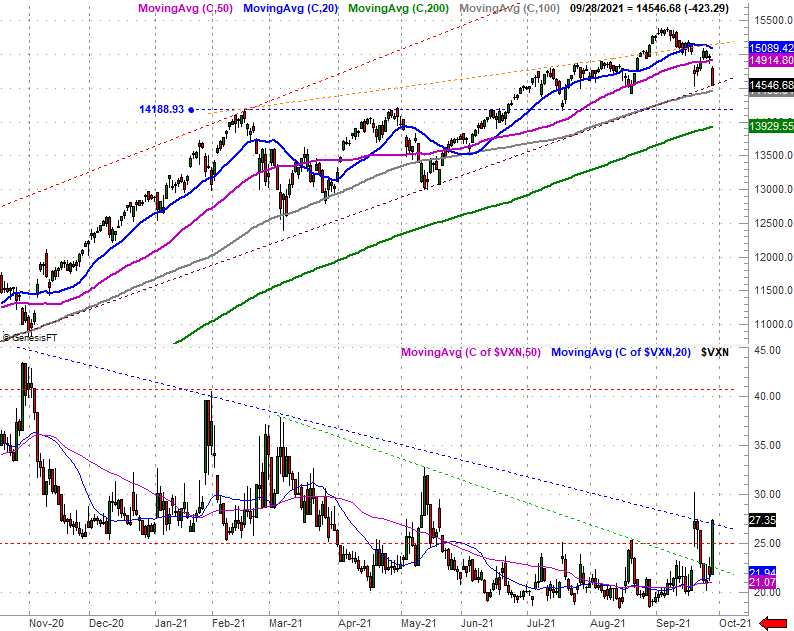
The NASDAQ's chart is different than the S&P 500's in one big way, however... the NASDAQ Volatility Index popped (albeit just barely) its falling resistance line that's been steering it lower since September of last year.
Maybe it's irrelevant. The VXN isn't exactly trending higher. Indeed, the VXN popped so hard that it's primed to pull back the same way the composite itself is poised to bounce off the floor it found today. On the other hand, breakdowns are more of a process rather than an event. It may take a few days to redirect both the NASDAQ Composite and the NASDAQ Volatility Index into a truly bearish direction, beginning with a bit of bullishness for the market and weakness from the volatility indices on Wednesday.
And that certainly feels like the more plausible outcome when you take a step back and look at a weekly chart of the S&P 500. Although the index didn't break under its 100-day moving average line today, it's clearly below a couple of important technical floors that are responsible for much of the gain logged since the latter part of last year.
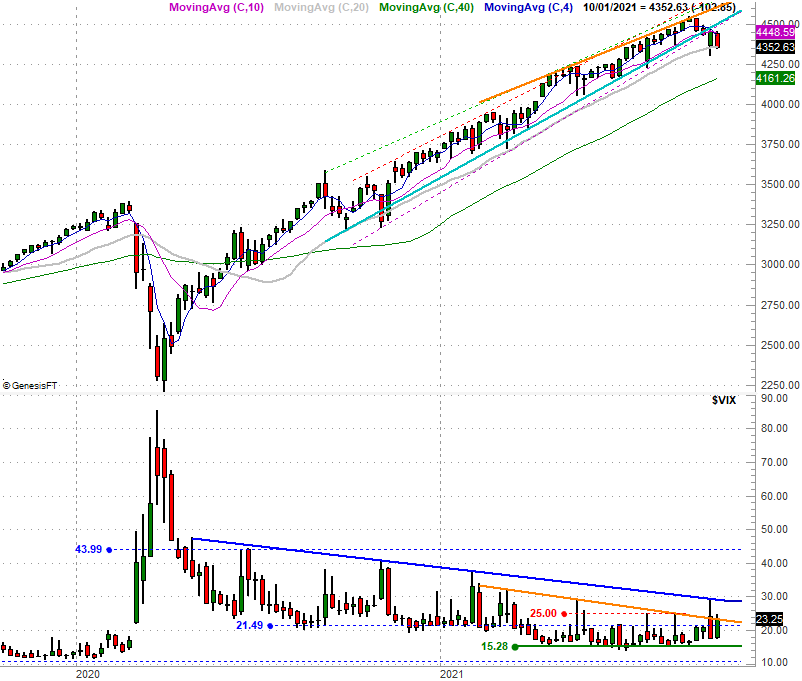
In other words, in at least one way the S&P 500 has already broken down. It just needs to do it again before there's no chance at a recovery without a major correction unfurling first.
We're looking for a rebound effort on Wednesday that could persist into Thursday. If stocks bounce though, sometime within the next couple of days the S&P 500 will face what's sure to be a telling test. That's the potential resistance waiting for it at its 20-day (blue) and 50-day (purple) moving average lines at 4461 and 4444, respectively; the former's about to cross under the latter as well. If we see that happen be concerned. If we see the S&P 500 then break below its 100-day moving average line and also see the VIX push above the uppermost of its ceilings (currently at 28.6), then be afraid.