Don't Sweat Just Yet. Thursday's Drubbing Only Dented the Rally.

Yes, Thursday's 3% selloff for the NASDAQ Composite was its worst single day for the year thus far. The S&P 500's selloff was a more modest 1%, but given the backdrop and the cause - a spike in bond interest rates - it would be easy to fear the worst for the broad market. The fact that all sector and market cap groups fell underscores the idea that there's nowhere to hide from the overbought market's vengeance.
Don't sweat it just yet though. Take a step back and look at the bigger picture. Even with the big selloff, the uptrend that's been in place for over a year now has barely been scratched.
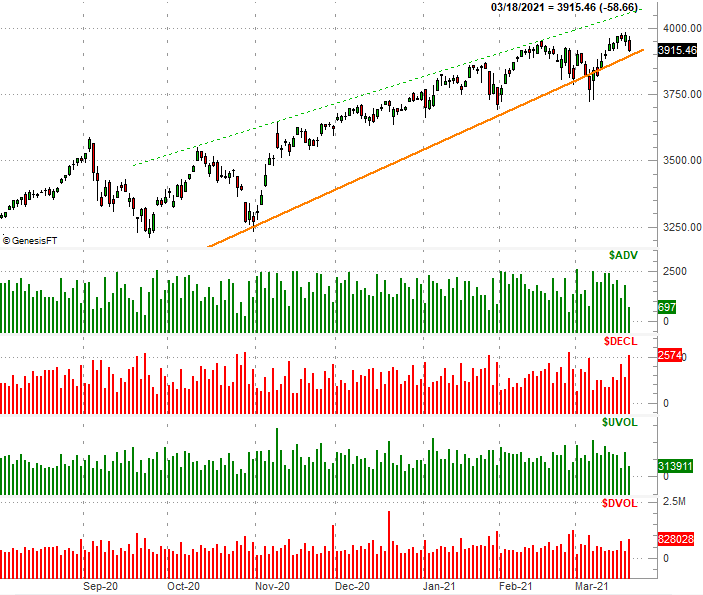
The daily chart of the S&P 500 below puts things in perspective. The pullback is from record higher hit on Wednesday. Even with the selloff, the index remains above all of its key moving average lines including the 20-day moving average line (blue) at 3887. It's also still above the support line (orange) that's been guiding it upward since last March's low. Also notice that the volume behind the big dip was pretty modest, particularly given the scope of the selling.
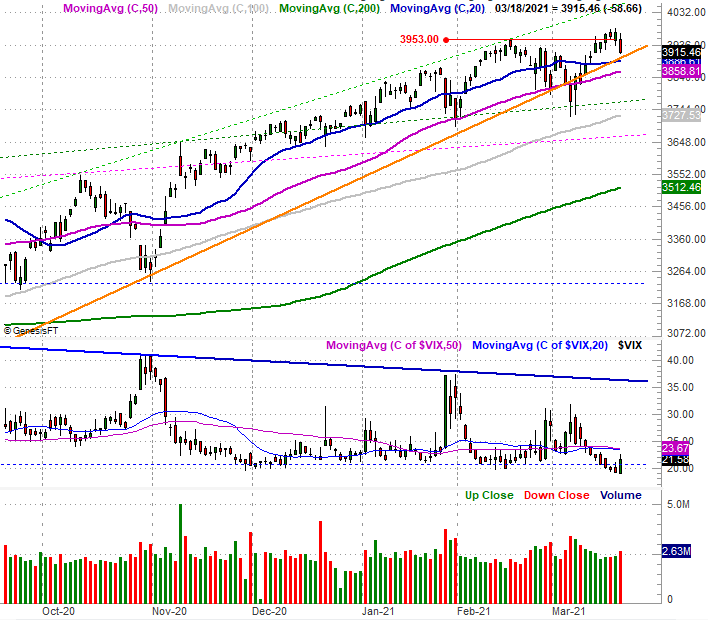
The chart is hardly a thrilling one for the bulls, however. Namely, the VIX remains closer to an absolute floor near 20, with little to no room left to keep moving lower.
It's a tricky, philosophical debate. Clearly a bullish mindset is important fuel for market rallies. But, the market's been making gains for months now not on new news, but the same good news being recycled over and over again. We know the economy is rebounding. We knew it was going to by the latter half of last year. How much higher can it go before traders start to believe it's gone too far? The VIX has historically been a helpful measure in this regard, reaching a floor at the same time the market is peaking, and reaching a peal the same time the market is bottoming. But, the fact that the VIX has been hovering around its floor for weeks now suggests the rally's on borrowed time. Stocks won't (or at least shouldn't) hit a major low until the VIX makes a clear peak not unlike the one seen in late January or late October. The fact that it hasn't yet implies the market itself hasn't hit a firm low that sparks a rebound.
One detail about volume... while there wasn't much of it for a tumble of this size, what there was was decidedly bearish. For NYSE-listed stocks, down volume outpaced up volume by a margin of about 2.6 to 1. Breadth, or advancers versus decliners, was bearish at a rate of 4 to 1. Even so, it's not like the sellers are suddenly scrambling out of the woodwork to bail out of stocks. The daily bearish volume was still only about average for Thursday's session. If traders were truly fearful here, it would not only show up in the form of a soaring VIX, but also in the form of soaring bearish volume.
Don't misread the message. Stocks have been due for a big correction for some time now, but this doesn't necessarily mark the beginning of it. At the very least, when it starts to happen, the VIX will start to make a clear move upward, and the 20-day and 50-day (purple) moving average lines will start to fail as support.
The fact of the matter is, however, the potential for a big pullback looms above.
So what's keeping the rally alive? FOMO (or the fear of missing out) is high right now, and much stronger than sense and reason. That's enough to keep a rally alive, although that's also the crutch that crumbles fast and without warning once it finally fails.
The good news is, we at least know what to look for.