Big Bounce? Don't Read Too Much Into Monday's and Tuesday's Action.

Yes, the bulls are rockin' and rollin' here. The S&P 500 just logged its best two-day gain since April of 2020, rallying 5.7% from Friday's close. The move offers a glimmer of hope for those traders who lost it after last Friday's tumble under some key technical floors. Just don't jump to any sweeping conclusions about what you think it means. Stocks haven't actually done much to under the bigger-picture downtrend.
Take a look at the daily chart of the S&P 500 below. It broke below a key support level at 3630 on Friday, which portended more downside. The bears didn't follow through on the move though, yielding to extreme bullishness on the first two days of this week.
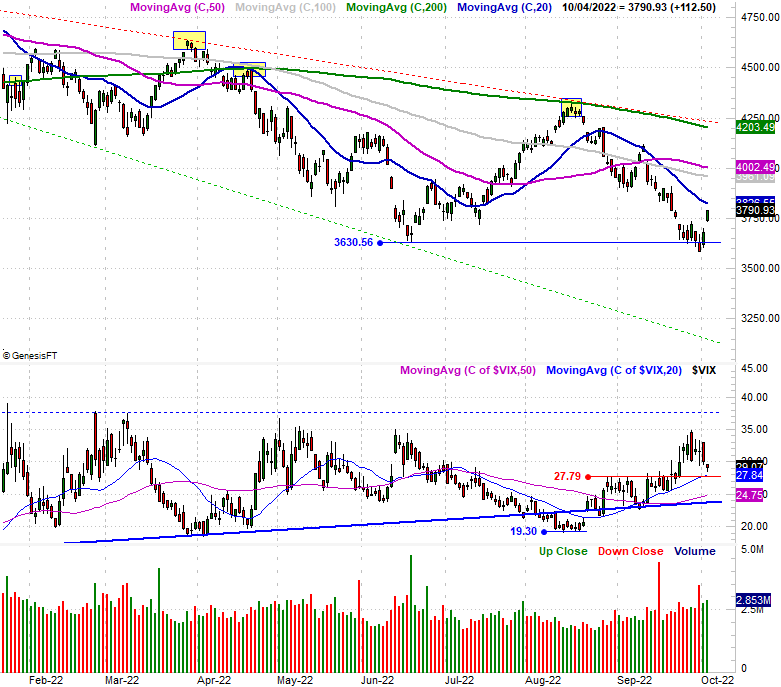
The problem is, even with the big move, the index still hasn't actually made any major technical progress. Namely, it's not yet hurdled the 20-day moving average line (blue) at 3829. Notice the S&P 500's Volatility Index (VIX) isn't exactly plunging either. If conviction behind this upward thrust was high, the VIX would be moving much lower.
The NASDAQ Composite's chart is telling us the same basic story, although with this chart the reversal makes more sense. Friday's low of 10,546 perfectly aligns with June's low. Traders drew a line in the sand there four months back, and are holding the line now.
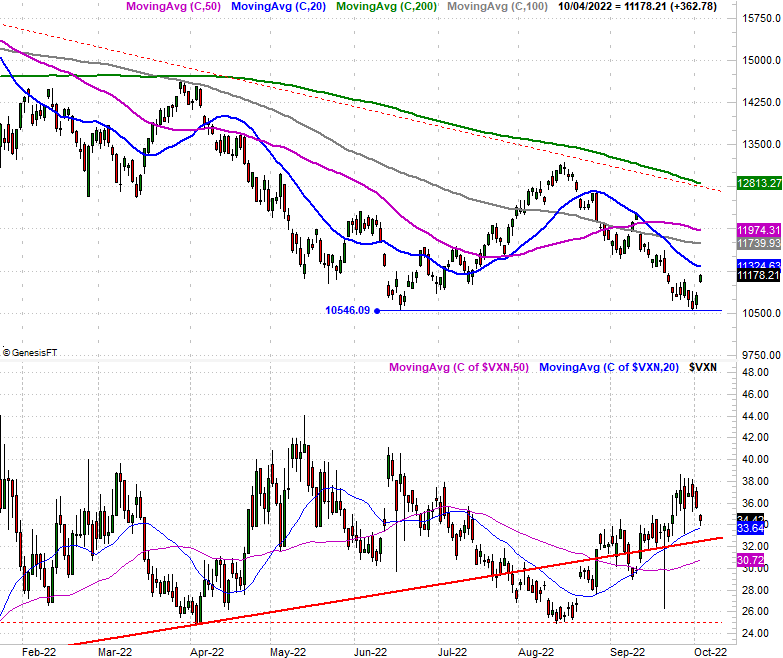
Even so, there's nothing to suggest with any certainty that this two-day rally is actually going anywhere. Like the S&P 500, the NASDAQ Composite hasn't even yet hurdled its 20-day moving average line (blue) at 11,324. For all we know, this two-day jump could just be a bout of volatility.
Also note that the VIX as well as the NASDAQ's Volatility Index (VXN) are not only not making meaningfully lower lows, but ended Tuesday's action edging up and off their intraday lows. It's again a hint that traders aren't as decidedly bearish as the market indices would suggest they are.
Maybe... maybe this is the beginning of prolonged bullishness. Or, maybe not. We just don't know yet. What we do know is that even with a fantastic two days, not much has actually changed. The 20-day moving average lines will need to be cleared before even thinking about getting bullish in a big way, and even then, there's a whole band of resistance -- framed by a handful of other moving average lines -- above that level for both indices.
The good news is, while we may be due for another leg lower, October bottoms tend to be major pivots out of bear markets and into new bull markets. We can at least hope.