As Of Tuesday, Stocks Are (Still) Hanging By a Thread
The market's in the red for the week, losing ground on Monday and then giving up intraday gains on Tuesday. The S&P 500, however, still hasn't broken below the major technical floor that's staving off another serious round of selling.
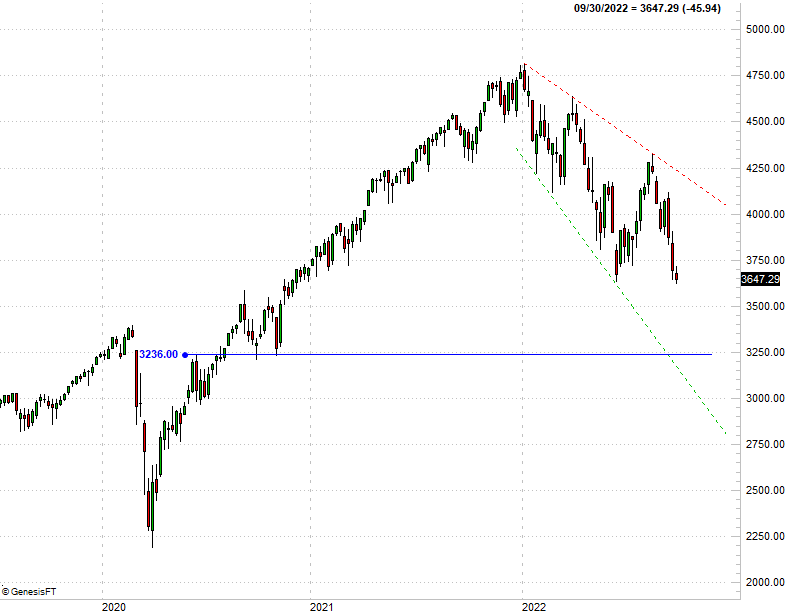
We mentioned it in Sunday's Weekly Market Outlook but it bears repeating now... the S&P 500 is dancing with support at 3630, where the index bottomed in June. Tuesday's low was 3625, and the index edge back up to close at 3647. The bears really need to log a close below 3625 to kick-start the next bout of bearishness, so there's still hope; stocks are even acting like they're looking to move higher on Wednesday. That's not necessarily a hint of prolonged bullishness though. It could just be a temporary reprieve from a bigger-picture pullback at an opportune level.
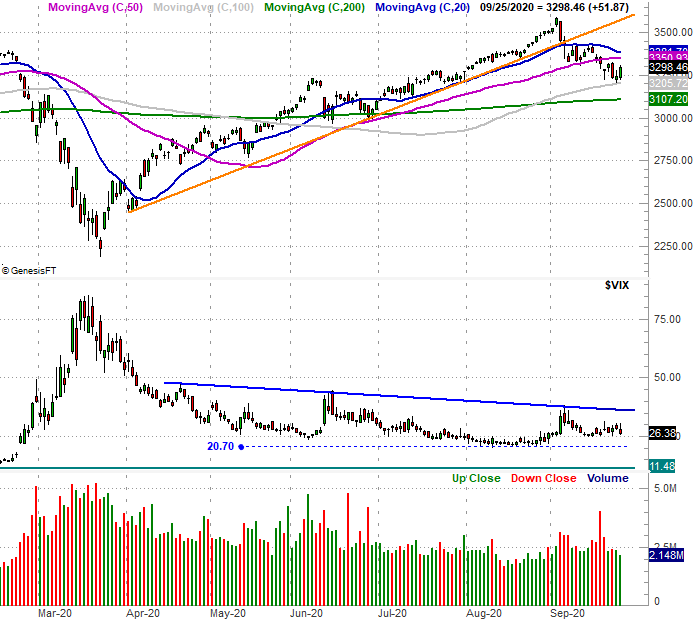
What we're really eyeing here, however, is the S&P 500's Volatility Index (VIX) on the bottom half of the chart. It's moving higher in step with the market's pullback, but has yet to test a key technical ceiling at 37 (blue, dashed). That's more or less where the VIX has peaked with every major market low for the past several months. It's not happened this time around -- yet -- but that prospect is certainly on the radar.
And there's the rub. If the S&P 500 falls under its floor at 3630, it could start a cascade of selling that lasts a few days, shoving the VIX well above its resistance around 37.
In other words, the timing (and distance) is a bit off.
That's not necessarily a vexing, problematic scenario. It's possible for the VIX to simply reach the 37 ceiling and drift sideways for a few days while the S&P 500 continues to lose ground. In fact, that's a rather plausible scenario. When you back out to a weekly chart of the S&P 500 though, things get tricky again.
Take a look. Since the market's pivot out of an uptrend and into a downtrend at the beginning of this year, it's been navigating a widening wedge pattern. That is, the floor (green, dashed) and ceiling (red, dashed) are diverging, and the S&P 500 continues to bounce back and forth between both of them. Presuming the pattern holds up, the index is due to slide all the way back to the lower boundary. That would drag it all the way back to just above the 3000 area at its current pace of selling.
Of course, if that's in the cards, the VIX itself is unlikely to stop at 37. It's more likely to be catapulted to the 50+ area. A selloff of that magnitude, however, seems less than likely. More plausibly, a little more selling now is apt to drag the market somewhere between its current floor at 3630 and the ultimate floor currently near 3000.
Another possible floor? The 3236 area, where the S&P 500 last bottomed in late-2020 before starting what turned into an incredible rally. That's also where the index peaked with the immediate bounceback surge following the COVID-inspired meltdown in early 2020.
Still, there's no real clear basis for where the technical floor might be in the midst of that band.
That's why we're keeping closer tabs on the VIX's levels (and ceiling in particular) than the S&P 500's technical floors. That's where any clues as to the market's next direction are most likely to show up. When the VIX makes a sharp spike that it clearly can't follow through on or even starts to trend lower again, the market's bottom is apt to be in.