An indicator that's '90% accurate' suggests hidden strength in the stock market
By Ryan Vlastelica, MarketWatch
The U.S. stock market may feel particularly risky right now, as major indexes have been volatile throughout 2018 and there are a number of headwinds that investors are monitoring, but things may not be as bad as they seem.
There are multiple signs of equity strength going on below the surface of the major indexes, which could be a signal that the recent uptrend in stocks is justified and could continue.
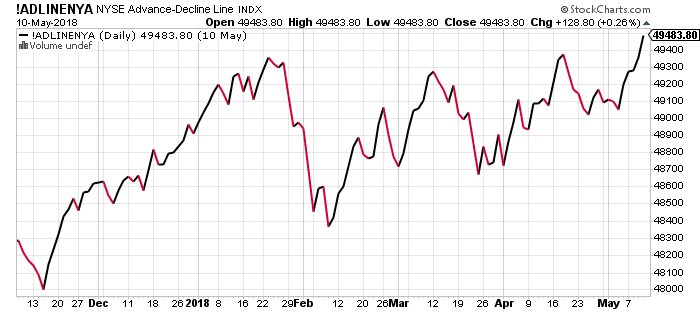
One positive signal looks at the ratio of rising stocks on the New York Stock Exchange to the number of falling ones over time. Paul Schatz, the president of Heritage Capital, referred to this as "the one indicator that's 90% accurate" for forecasting moves.
Currently, the NYSE's advance/decline line is at an all-time high, as seen in the following graphic from StockCharts, which Schatz included in an email.
StockCharts data, courtesy Heritage Capital
"When the major stock market indices make new highs but the NYSE A/D Line does not, that's where bulls should begin to worry," he wrote, adding that "the exact opposite is happening," which he said was "typically a good sign for further strength in stocks over the medium-term."
Both the Dow Jones Industrial Average and the S&P 500 are more than 5% below their records, and they have been in their longest stretch in correction territory since the financial crisis.
The improving A/D line is an encouraging signal for the investors who have been worried about market breadth, especially as some of the market's biggest names - notably the FAANG group of large-capitalization internet and technology stocks - have been leading the overall advance. Because the market's biggest companies have been seeing the biggest gains, those leaders can mask weakness in smaller companies. Schatz compared it to a building where the foundation "is full of cracks and is crumbling but the penthouse looks flawless with million dollar art and furniture."
The improving breadth is helping to support equities, which can be seen in the broader indexes themselves. The Dow Jones Industrial Average, for example, is coming off seven straight positive sessions, while the Nasdaq Composite Index COMP, -0.03% has risen in five of the past six. The Cboe Volatility Index fell for a fifth straight week last week, a sign that anxieties are leaving the market.
"We found good support at the low end of the trading range we've been in, and now all of a sudden we're getting a breakout. We haven't made a new high since January, which is a long time, but the pattern is starting to change. The highs we're making are getting higher," said Donald Selkin, chief market strategist at Newbridge Securities.
Both the Dow and the S&P have shown signs of maintaining their longer-term positive momentum. Both broke below their 200-day moving averages on an intraday basis twice earlier this month, but they subsequently rebounded to close above it each time. Ending below that level, a closely watched gauge for long-term price trends, is seen as a bearish signal, but holding it could be a sign of support for equity prices. Since testing the level, the Dow and S&P have returned above their 50-day moving averages, which is used as a proxy for short-term momentum trends.
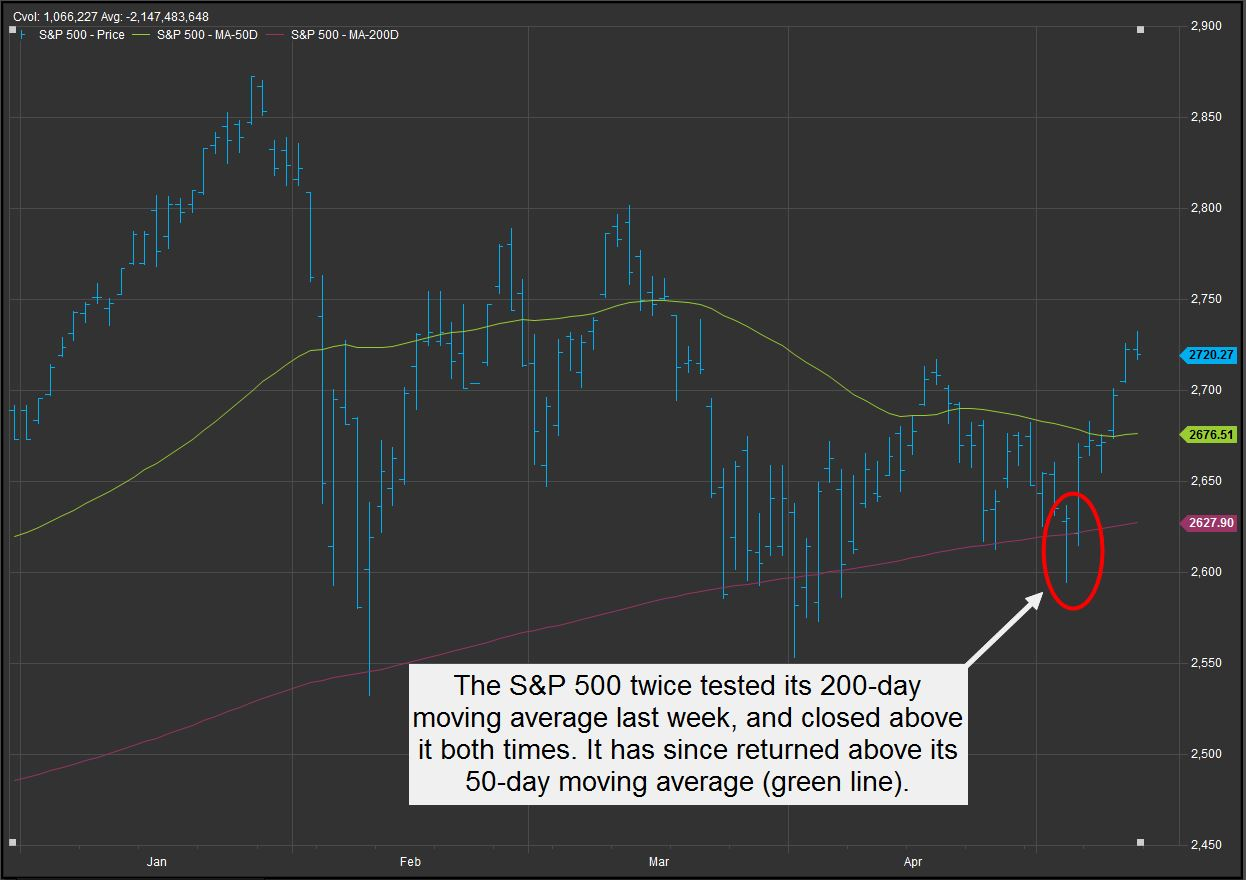
Courtesy FactSet
Again, this isn't simply a matter of the market's biggest names leading the overall indexes higher. According to StockCharts, 61.1% of the S&P's components are now above their 200-day, up from just 50% last week, and back above the 59.55% average over the past 50 sessions (the 200-day average for S&P 500 components above their 200-day moving average is 69.44%).
For the 50-day moving average, 61% of the S&P's components are above this level. That's above this ratio's 50-day and 200-day averages, as well as up from 47% last week.
Ari Wald, head of technical analysis at Oppenheimer, added that the number of net new lows - the number of stocks making 52-week highs minus the number making 52-week lows - had been dropping, a trend that suggests "the selling in stocks is getting less bad."
He added, "This means that we've been holding up well in periods of consolidation and that the market has been finding a base. This is setting us up for the next move higher in the bull market."
From MarketWatch