A rare batch of selling suggests the stock market may have just hit 'rock bottom'

By Shawn Langlois, MarketWatch
If recent market action feels extraordinary, that's because it has been.
In fact, we're seeing something that hasn't happened since 2008, and, according to Dana Lyons of J. Lyons Fund Management, has only occurred a scant 11 times since 1960 - four straight sessions delivering intraday declines of at least 1.89% on the S&P 500.
A rare streak of selling pressure, no doubt.
But as wrenching as this year has been for many investors - like this guy who has lost 99% in his portfolio - there's reason to believe, at least in the form of this chart, that such downward pressure suggests bullish times ahead:
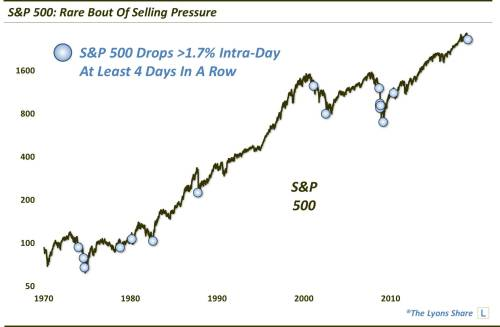
The dots on the chart signal instances when the S&P dropped at least 1.7% for four sessions in a row, which has happened 17 times since 1960. As you can see, the bulk of theses drops, particularly recently, took place near clear market bottoms, including 1974, 1982, 1987, 2002 and 2009.
"That might give bulls some hope that perhaps things have gotten so bad, i.e., rock bottom, that there's nowhere to go but up," Lyons explained in a blog post. "Although, it is probably a stretch to conclude that we are at a cyclical low right now since we were at all-time highs just about 10 weeks ago."
He then points to the handful of times it didn't exactly play out that way, like when stocks went "subterranean" in 1974, 2001 and 2008.
Time will tell if we've just bounced off some sort of bottom - Jeff Gundlach certainly doesn't see it playing out that way - but it's on track, if Wednesday's strong rally is any indication. At last check, the S&P 500 and the Dow Jones Industrial Average were both up more than 1.5%.
From MarketWatch