
Low VIX Doesn't Necessarily Mean Market Is Near Major Top
The VIX is low, but it's too low to signal a major market top
Contrarian investing 101 says low volatility means high complacency, is that true today?
The CBOE Volatility Index (VIX) (VXX) recently closed at 11.77, the lowest level since Aug. 26, 2014.

According to contrarian investing 101, low volatility means high complacency, and high complacency is usually seen near major market tops.
Based on recent headlines, the media and the “pros” agree with basic contrarianism right now:
- Barron's: The VIX is crazy low; time to run for cover?
- CNBC: The rally is running out of steam, expert says
- Barron's: 3 reasons to worry that stock rally's end is near
- MarketWatch: Dow, S&P 500 are overheating – and Wall Street is freaking out
The current environment reminds me of the first half of 2014, when the VIX also hovered around 11. Here are some headlines from back then:
- Yahoo! Finance: Common sense says look out for a market top
- CNBC: This chart shows the market is a ticking time bomb
- MarketWatch: If ever there were a time for a stock sell signal, it's now
- Yahoo! Finance: Beware: 2014 looking a lot like 2007
What I'm about to share will probably earn me at a wave of criticism. At least it did back in 2014.
This analysis below was initially published for subscribers of the Profit Radar Report on June 16, 2014. At that time, the VIX VIX, -7.39% was near 10, not too far from where it is today.
"Financial Advisor Magazine just published an article titled 'Black Swans Love a Low VIX.' Surely if an industry magazine advising financial advisers implies a VIX induced 'Black Swan' event, it must be true.
Along the same lines, the Financial Times reports, in a piece titled 'Financial markets: Hurrah Before the Storm,' that: 'The VIX index is near seven-year lows. Like sailors sensing a lull before the next storm, some industry veterans warn of possible trouble ahead.'
Facts vs. Conventional Wall Street Wisdom
Conventional Wall Street wisdom suggests that extremely low VIX readings precede major market tops, but the facts disagree.
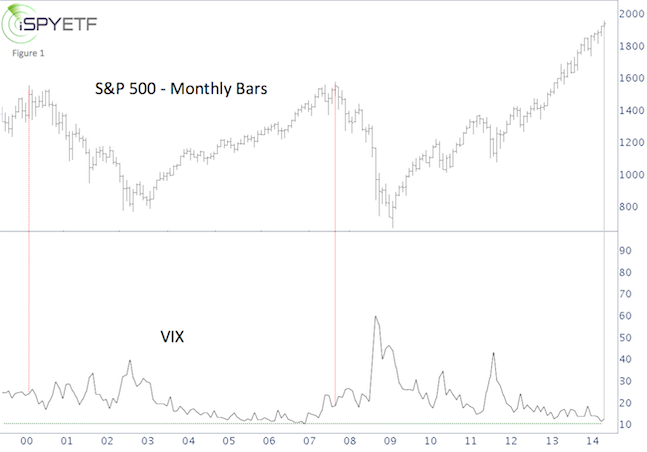
The last two major stock market tops did not coincide with low VIX readings.
Figure 1 offers a long-term comparison between the S&P 500 and the VIX. The dashed red lines mark the March 2000 and October 2007 tops.

Figure 2 provides more details on the 2000 high. The S&P 500 recorded top tick at 1,552.87 on March 24. The VIX traded at 22.12 that day.

Figure 3 zooms in on the 2007 top. The S&P 500 peaked on October 11 at 1,576.09. The VIX traded as low as 16.08 that day.

On June 6, 2014, the VIX dipped to 10.73, the lowest level since February 26, 2007. This may represent a certain degree of complacency, but based on recent historic patterns, it's not a signal for a major top."
To sum up, the last two major market tops SPX, +0.16% , in 2000 and 2007, occurred when the VIX traded at 22.12 and 16.08. Currently the VIX is around 12.5.
The sample size is uncomfortably small, but there are simply no other major market tops since the VIX’s inception in 1990.
Based on the available history, the conclusion today is the same as it was on June 16, 2014: "This may represent a certain degree of complacency, but based on recent historic patterns, it's not a signal for a major top."
The VIX is low enough for a stock market correction, but the scope of a coming correction is likely to surprise investors, as this multiple indicator-based S&P 500 analysis shows.
Courtesy of marketwatch.com