- The deck is stacked against the market right now -
It's here... almost. That is, the worst month for the market is just around the corner. In September, the S&P 500 loses between 0.6% and 1.6% of its value, depending on how far back you look. No matter what your timeframe is though, the coming month dishes out losses more often than not, and the losses aren't mere "blips" either.
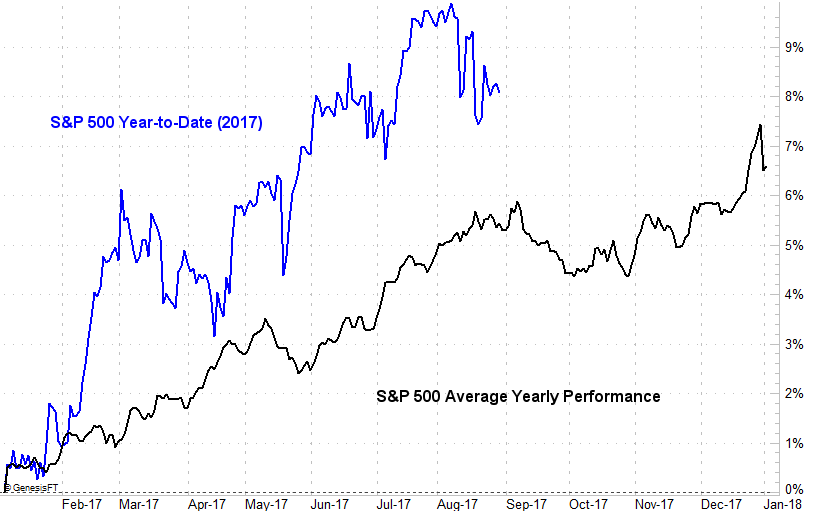
In fact, 2017's September could be particularly ugly, judging from the way we're wrapping up August and the foot we're starting the new month on.
At first glance, this morning's bearish gaps left behind following the weak open are not only begging stocks to rally -- to fill the gaps -- the market's already working on closing those gaps. As of the most recent look, the indices are at or near their high for the day.
This bullish pressure loosely hints at a recovery move, and if interpreted by enough people for long enough that way, it could become just that. There are a couple of major hurdles dead ahead though, that could quell the bullish effort pretty quickly. Those are the 20-day moving average line (blue) and the 50-day moving average line (purple); the former is about to cross below the latter for the first time since April, making it an even tougher hurdle to clear.
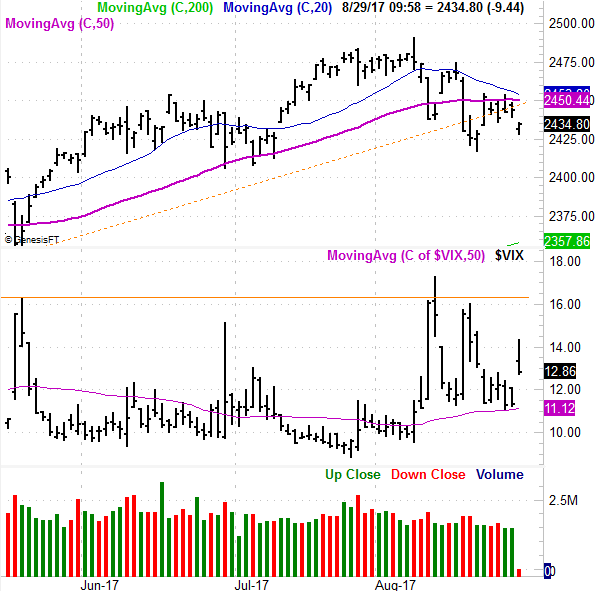
That doesn't mean we can't or won't squeeze a couple days' worth of bullishness out of today's bearish start. The VIX also gapped higher and as of the latest look is also peeling back... with some room to keep moving lower. It's what happens two to three days from now that will tell the tale. If the S&P 500 finds resistance around the 20/50-day average lines that have intersected, odds are good traders will throw in the towel then, convinced the usual September weakness is going to haunt the market this year.
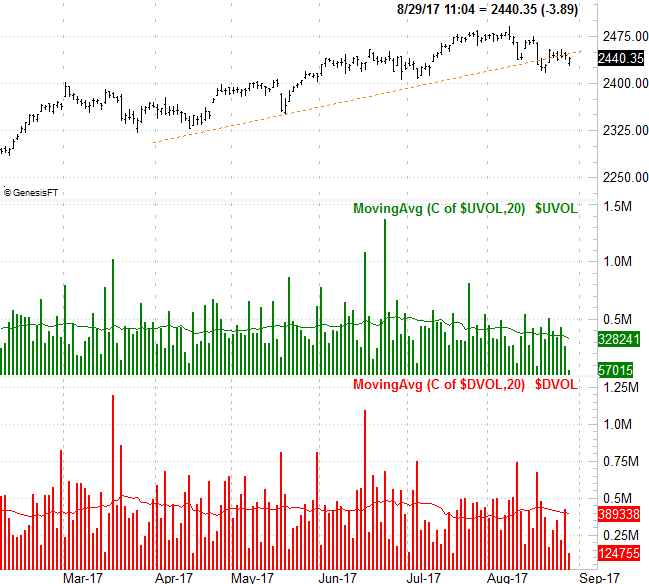
Underscoring that potential pullback is the nagging fact that there's been very little bullish volume behind any of the recent market gains. Conversely, there's been lots of volume -- more bearish volume than bullish volume -- on recent days the market has lost ground.
And just for the record, it's not just a mere myth or skewed math that suggests September is a tough month for the market.
Going back to 1929, the historical loss for the S&P 500 is 1.1%. That figure may actually understate the risk the month poses to investors though. The peak isn't usually made until the first full week of the month. From that high to the close, the S&P 500 generally loses 1.4% of its value. The few days between now and the first full week of September are just enough time for stocks to make good on today's bulls hints, test the 20/50-day moving averages lines, and then lower the boom. Throw in the fact that the S&P 500 is so far ahead of schedule this year, and there's even more potential for a strong September selloff.
Never say never. The market loves to throw curve balls and do unexpected things. On the other hand, the historical norms are the norms for a reason. When they're lining up with the technical red flags that are waving anyway, it would be short-sighted to ignore the warnings.