Is This Unusually Strong Bullishness a Warning That the Rally is Tired?

In the world of trading, the phrase "this time is different" is a dangerous one. This time is usually NOT different. The phrase is uttered -- generally -- by traders who so desperately want (or need) things to be different this time. Most of the time, things aren't different.
Nevertheless, knowing the perils of making assumptions based on hope shouldn't drive anyone to ignore reality when things truly are different.
With that as the backdrop, it's worth noting that a key sentiment tool has taken an unusual turn in a very bullish direction... reaching a very different level that we've not seen in over a year. This time truly is different, though we'll be the first to acknowledge that the difference isn't exactly damning to the rally as we know it.
The sentiment gauge in question is the option market's put/call ratio, or a measure of the number of puts that exchange hands on any given day compared to the number of calls traded that same day.
A (very) quick lesson on put options and call options. A put option is a bearish bet... a bet that a stock or index will move lower within a certain timeframe. Traders buy more puts when they're feeling bearish. Conversely, call options are bets that a stock or index will rise within a certain timeframe. Traders will want puts when they feel good about the future.
On any given day, traders will buy about 50% more calls than puts, as the market is generally expected to go up. That keeps the put/call ratio right around 0.65 or 0.70 in a normal trading environment. It's when the ratio gets above or below that range that serves as a red flag. A move to... say 0.55 means traders aren't nearly as interested in puts as they are calls, indicating a bullish mindset. At the other end of the spectrum, a put/call ratio above 0.75 indicates extreme bearishness, as traders buy fewer call options and more put options.
Here's the twist: The put/call ratio is a contrarian indicator, meaning when the market is thinking and trading bearishly, it's actually bullish. When the market is thinking and trading bullishly, it's actually a bearish clue. No, it's not an ironclad outcome, but the strategy bears more fruit than not.
That being said, take note that the 20-day moving average [we use a moving average to smooth out the day-to-day volatility] of the put/call ratio has reached a multi-year low of 58.1. Traders are more optimistic -- at least as measured by put and call trading activity -- than they've been since late-2014. Take a look. [Click on the image to see the full-screen picture.]
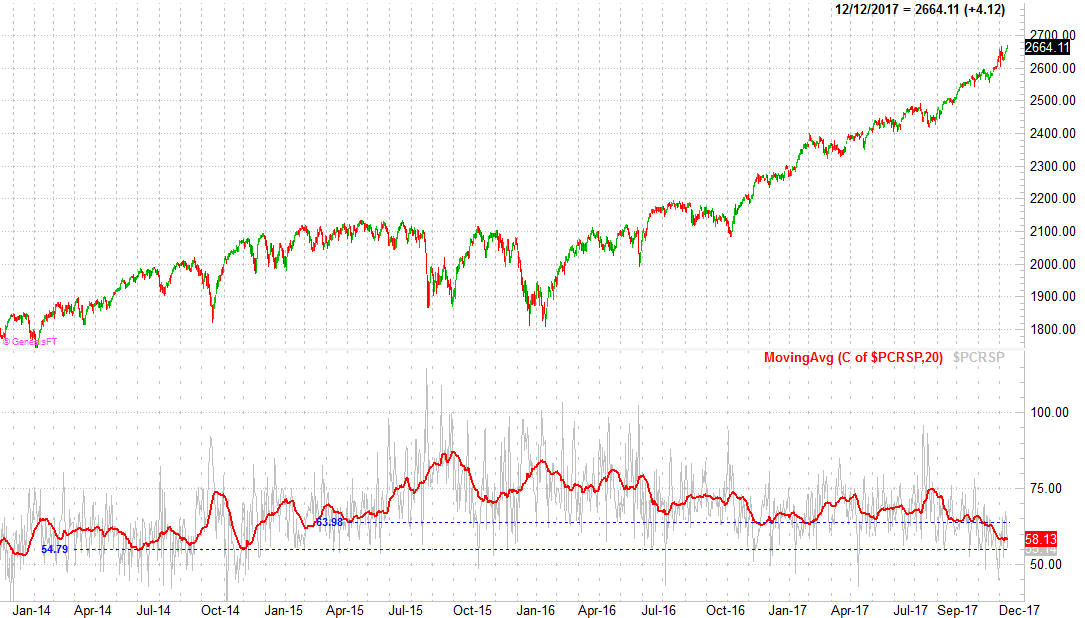
A scan of the relationship between the S&P 500 and the put/call ratio does indeed indicate that the ratio hits a major low before pullbacks. The hard part about jumping to conclusions bases on this relationship, however, as that the low point for the put/call reading changes from cycle to cycle.
Still, at 58.1, the put/call ratio is not only at a term low, but at a multi-year absolute low. Maybe it's nothing, but it's certainly an unusual scenario that's nothing to ignore.
As is the case with all tools, we have to accept the fact that this one isn't bulletproof, nor does it give us any indication about when a pullback may finally start to materialize if that is indeed what's in the cards. The stage is set on this front though, which may underscore other red flags you're seeing.
Looking to re-create this chart and keep tabs on it (or test it) yourself? Great! Just note that we're using the "equity only" version of the put/call data, which excludes index options. We've found that many traders -- individuals and institutions alike -- use index options as a hedge rather than a direction bet, skewing its value as the psychologically bullish/bearish indicator we need it to be that makes it a sentiment tool.