Inflation Fears Weren't the Cause for Wednesday's Selloff. They Were Just the Excuse.
For a short while on Wednesday it looked like the market might get over a major hump... but only for a short while. Once the minutes from the most recent meeting of the Federal Reserve's chiefs were posted, the bulls turned tail rather quickly. The slight gain that toyed with the idea of getting the S&P 500 over its 20-day moving average line turned into a loss of 0.55% by the time Wednesday's closing bell rang. Traders just don't think the market can stand up to the stepped-up inflation the Fed sees in store.
That's the excuse traders are offering anyway, or at least the ones the media is telling traders they need to use. Truth be told though, the cause-effect relationship being batted around isn't really the reason stocks rolled over. Rather, this rollover looks like it was going to happen no matter what. The market just needed a good excuse to get the ball rolling.
But, first things first. In short, the Federal Reserve sees a rate-hike plan that was slightly more accelerated than previously thought. The good news is, that inflation is being driven by robust economic growth. The bad news is, that growth spurs inflation, and inflation gets in the way of .... everything, doesn't it?
Truth be told, there is some truthiness to the premise. Rising prices make it more difficult for companies and consumers to purchase all goods, slowing an economy down. Sometimes the slowdown is so abrupt it throws economic prosperity into reverse.
Sometimes.
Just bear in mind that more often than not, inflation can remain "too high" for months if not years on end, buoyed by a strong economy that offers consumers and companies more money to spend on higher-priced goods.
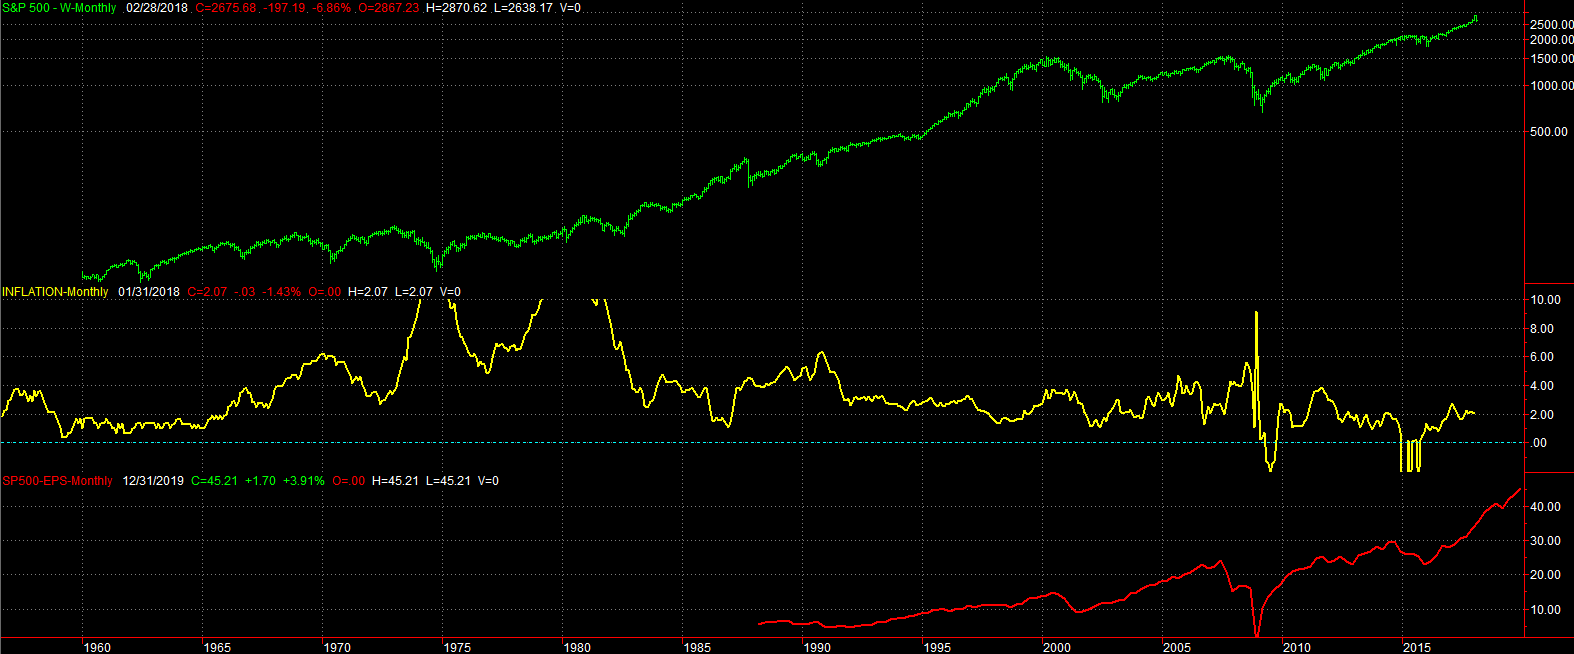
The graphic below tells the tale. The top plot is the S&P 500, in the middle you'll find the annualized inflation rate (CPI), and on the bottom you'll find U.S. corporate earnings for a far back as the data exists. Note the lack of correlation that inflation has with earnings, and with the market for that matter. By that same token, notice that weak inflation didn't always rekindle economic growth that spurs bull markets. [Click on the image to see the full-screen version.]
In essence, the chart makes it clear that strong inflation is not market-killing. It also shows that the bull market can withstand more inflation than we're seeing right now.
So why did the market retreat on Wednesday? Because traders tend to think and act aggressively, without recognizing such relationships, and by acting too strongly to headlines. In this case (and as was noted), many traders have been anticipating a pullback anyway. Now they have the "evidence" they've been wanting.
It's this pullback, in fact, that we want to take a closer look at, since it was rather well scripted.
Zooming into the daily chart of the S&P 500 it becomes clear that the 20-day moving average line (blue) has been acting as a ceiling since Friday. The bulls tried to hurdle it again on Wednesday, but not in earnest. The end result is a bar where the close was below yesterday's low. The intraday action on Wednesday, where the open was in the middle of the day's high/low range and the close was at the low, suggests a sweeping change of heart from traders....
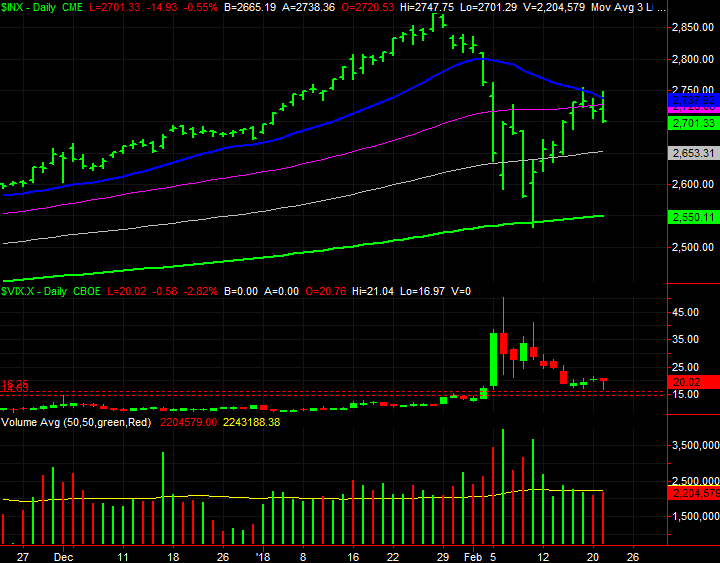
... though it wasn't actually that sweeping. If you take a look at the volume bars for the bullish days following the kiss of the 200-day moving average line (green) a week and a half ago, you'll see there was never a great deal of actual buying behind the bounce. Rallies need increasing volume to last.
You'll also see the VIX never edged below Thursday's low around 16.5, telling us that traders weren't willing to make bullish bets on the market using options. That's a first in a long while.
More than anything though, the problem at the 20-day moving average line is telling. This is exactly where you'd expect to see the sellers dig in again, if another wave of selling is in the cards.
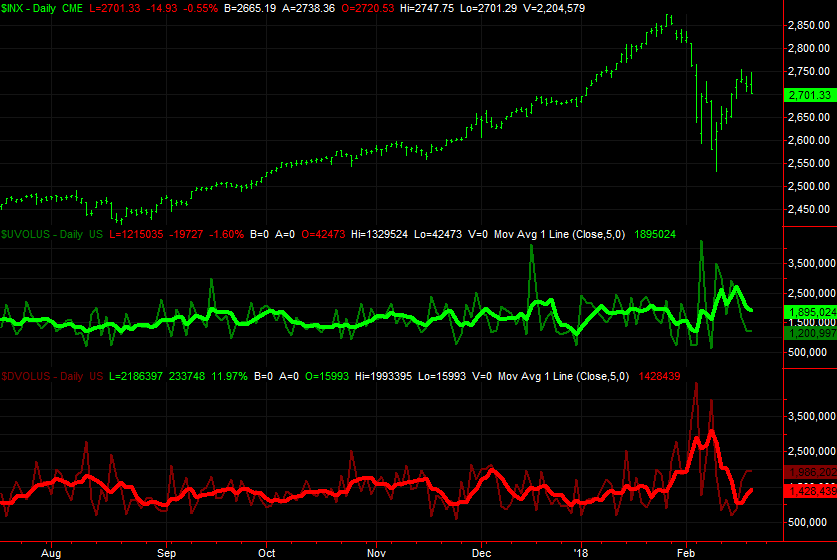
It's also worth mentioning (and as we discussed in detail on Friday) that what little volume we've seen of late hasn't been terribly bullish. Now, we're seeing that minimal bullish volume fade even further as the amount of daily selling volume perks up. Again, rallies need volume - bullish volume - to persist. [The bolder, brighter lines at the bottom of the chart represent the moving averages, or trend indicators, for the up-volume and down-volume data. Be sure to see last Friday's discussion for a full explanation of what the chart below shows you.]
This isn't a guarantee that stocks are going to dish out another shocking pullback; there are no guarantees in trading. It is to point out though, that from an odds-making perspective, this is the last thing the bulls want to see because this is exactly what the beginning of another bearish leg would look like. One more daily loss and close under Wednesday's low could be enough to pull the rug out from underneath the market, now that earnings season is all but over and there aren't any major economic announcements in the near-term queue. Keep a close eye on it.