Gold Price Futures (GC) Technical Analysis - Strengthens Over $1954, Weakens Under $1936
- The direction of the December Comex gold futures contract on Friday is likely to be determined by trader reaction to $1954.80 -
Gold futures are trading lower on Friday as safe haven demand continued to support the U.S. Dollar Index as traders took precautions ahead of the weekend due to heightened volatility in the U.S. stock market. Traders were also expressing disappointment after the European Central Bank (ECB) stopped short of offering any concrete signals on further stimulus. Nonetheless, lingering economic uncertainties kept the metal on track for a weekly gain.
At 12:12 GMT, December Comex gold is trading $1951.60, down $12.70 or -0.65%.
Essentially, gold speculators were anticipating strong ECB comments on the Euro's strength and hoping for the announcement of more stimulus measures, but policymakers kept quiet. Investors will now shift their focus on the U.S. inflation data due at 12:30 GMT for further clarity on global economic recovery. Traders also seem to be curtailing interest in gold ahead of next week's two-week U.S. Federal Reserve monetary policy meeting.
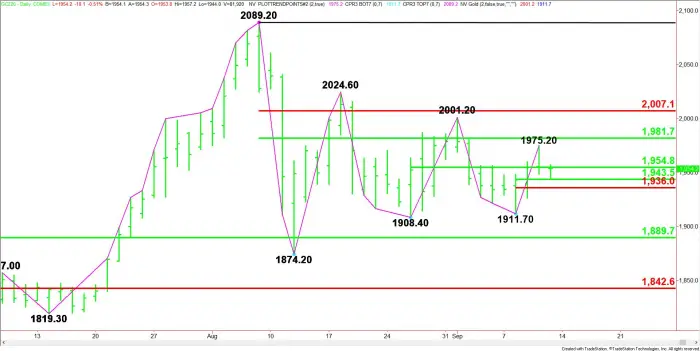
Daily December Comex Gold
Daily Swing Chart Technical Analysis
The main trend is up according to the daily swing chart. A trade through $2001.20 will signal a resumption of the uptrend. The main trend will change to down on a move through $1911.70.
The minor range is $1911.70 to $1975.20. Its retracement zone at $1943.50 to $1936.00 is providing support.
The second minor range is $1908.40 to $2001.20. Its 50% level at $1954.80 is acting like a pivot. The market has been straddling this level for nearly three weeks.
The short-term range is $2089.20 to $1874.20. Its retracement zone at $1981.70 to $2007.10 is potential resistance.
If the main trend changes to down then look for the selling to extend into the major retracement zone at $1889.70 to $1842.60.
Daily Swing Chart Technical Forecast
Based on the early price action,
Bullish Scenario
A sustained move over $1954.80 will indicate the presence of buyers. This could create the upside momentum needed to challenge the minor top at $1975.20 and the short-term 50% level at $1981.70.
Bearish Scenario
A sustained move under $1954.70 will signal the presence of sellers. This could lead to a test of the minor retracement zone at $1943.50 to $1936.00.
Taking out $1936.00 could trigger an acceleration to the downside with the next target a main bottom at $1911.70.
From FX Empire