It's not the ideal breakdown as far as technical breakdowns go, but the U.S. Dollar Index's demise today should be of concern to anyone who wants to see the greenback remain strong.
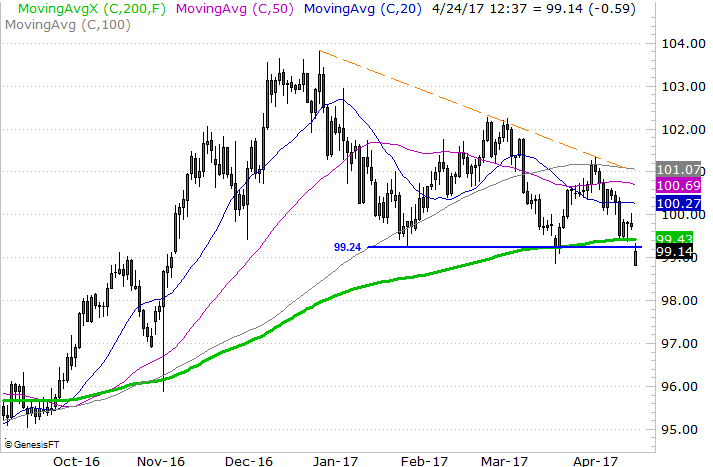
In the wake of France's election results pointing towards the maintenance of the status quo -- and likely keeping the country in the EU -- the U.S. Dollar Index fell rather precipitously today. Not only did the move yank the dollar below an important technical support level at 99.24, it dragged it below the 200-day moving average line (green). The index hasn't closed below that line since September of last year. In light of the downtrend we've seen the U.S. Dollar Index dish out since peaking in early January though, the breakdown was largely inevitable.
It's not the perfect breakdown, as was noted. The scope of the setback meant the dollar gapped sharply lower today versus where it ended last week's action. Generally speaking, gaps tend to get filled in. That suggests the chart is likely to climb higher before it moves lower again. Regardless, the move itself is a strong blow against the dollar itself, suggesting the bears have all but lost the battle.
It's not just the break below the 200-day moving average line that's working against the greenback at this time though. The downward move also pulled the dollar below a key Fibonacci line -- a dip below the 38.2% retracement level at $99.14. This is the second time we've seen a trip below this mark, and this time around the chart doesn't seem quite as well positioned to snap back.
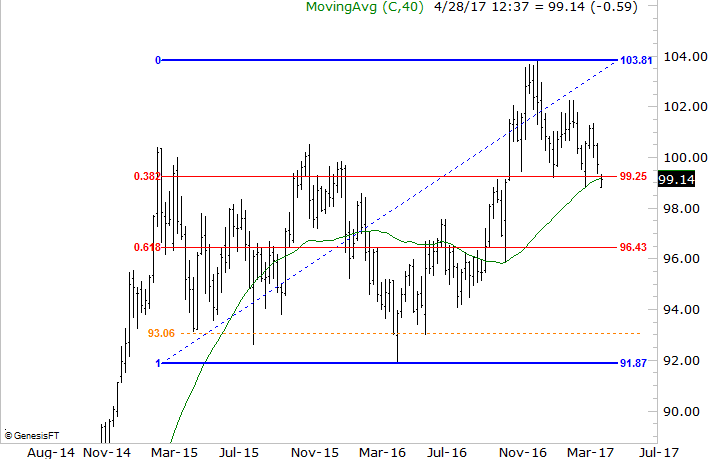
The chart with the Fibonacci lines overlaid on it also points to the most plausible near-term downside target. That is, the 61.8% retracement line at $96.43. That's not a former ceiling or floor. But, there's no other discernible line in the midst of all the 2015/2016 volatility that pronounced itself as support.
If the $96.43 line doesn't hold up as support, there's a minor support area around $93.06 (orange, dashed), and then there's the multi-month low of $91.87 that could come back into play.
As counterintuitive as it may sound, a falling dollar would actually do most U.S. stocks some good.
While a strong U.S. dollar makes foreign-made goods relatively cheap, it makes U.S.-made goods relatively more expensive to overseas buyers. In fact, for many United States companies that rely on foreign-produced revenue, they've found many of their best overseas customers can simply no longer afford to buy those goods and services (or domestic companies can't afford to sell those goods at a lower price). With the dollar in a downtrend, those organizations are proverbially "back in business."
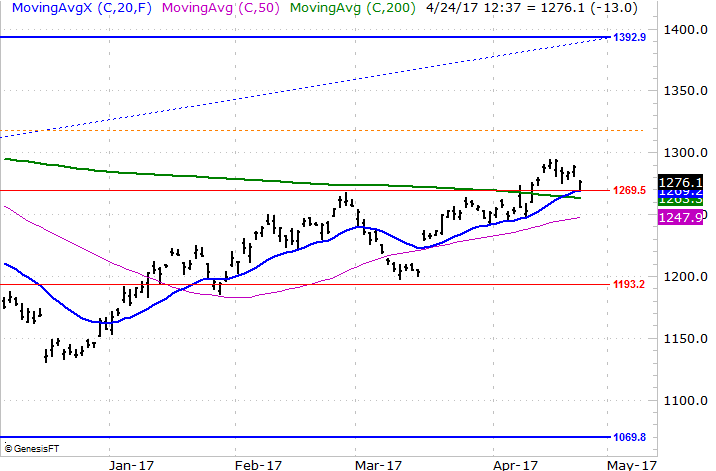
A weakening U.S. dollar is also bullish for commodities, including gold. In fact, gold futures largely confirmed they're in an uptrend today, playing off of their own Fibonacci lines in the opposite direction the U.S. Dollar Index is moving in relation to its Fib lines.
Take a look. Gold futures tiptoed to higher highs in the middle of the month, hurdling a 38.2% retracement line at $1269.50/ounce in the process. Though they took a big step back today as investors fled the metal and poured all that money into stocks -- a flight from safety -- that retracement line as well as the 20-day moving average line (blue) stepped up to the plate as support. The bulls pushed up and off that line in a pretty convincing fashion .
It's still not a settled deal yet. But, the greenback just tipped its hand, and it's not a very good one. A break back under the $99.24 level after any sort of bullish retest to close the gap could mark the beginning of the end, so to speak.