
It's up today, but don't read too much into the small gain. If you drop anything from high enough, it'll bounce. That's the most likely thing going on with the U.S. dollar right now. That is, after falling 2.2% over the course of the prior four days -- the most painful four-day stretch we've seen in years -- the U.S. Dollar Index is up just a bit today. The technical damage has already been inflicted, however. Not only is it possible the greenback will bounce, odds are good that it will. It just doesn't matter. Any bounce will likely end soon, without reversing the bigger-picture downtrend that started early this year.
As is usually the case, a chart tells the tale as well if not better than words could. To that end, note on the daily chart of the U.S. Dollar Index below has been trapped in a descending wedge since defining the lower boundary of that patter in late January. That falling wedge pattern wasn't confirmed until the early March peak, but it's clear now that it was forming; it's framed with orange dashed lines.
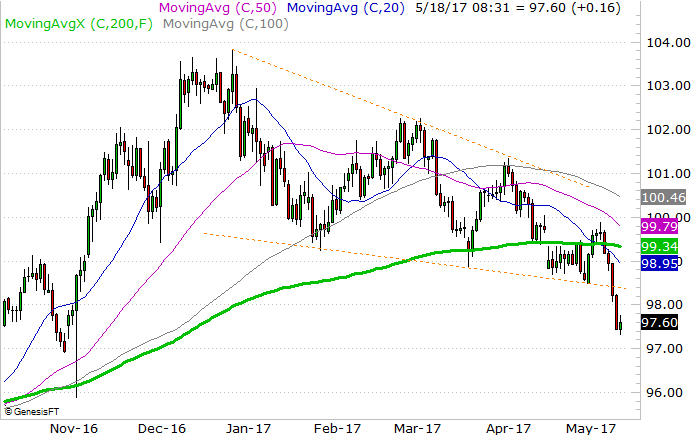
Equally clear is the fact that on Tuesday, the lower edge of that wedge pattern broke down as a floor. That happened just two trading days after the 20-day moving average line (blue) broke under the 200-day moving average line (green)... a 200-day moving average line that is sloped downward. Note that all the key moving average are falling now, suggesting the U.S. Dollar Index is bearish in all timeframes.
The clincher, by the way, would be a bounce back above the lower edge of the falling wedge pattern, followed by a tumble back under it. That will give the bulls a fair/last chance of quelling the downtrend. If they can't or won't do so and let the index break back under its lower support level, it's game over... at least for a while. Look for the 20-day moving average line to act as the pivot, if the bulls are even willing to make such en effort.
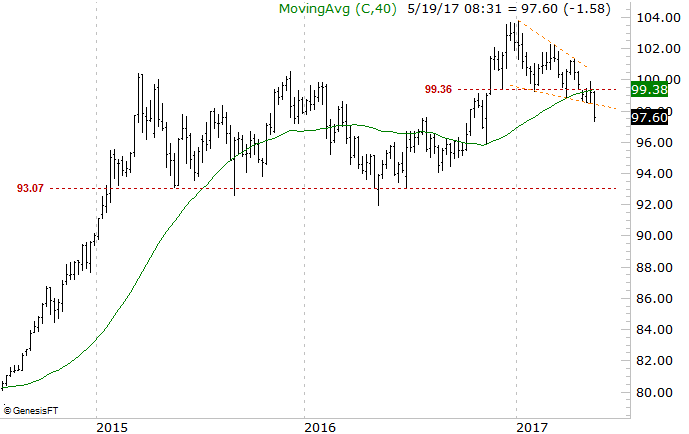
As for how far the greenback might fall if this downtrend takes hold in earnest, we have to zoom out to a weekly chart to see the U.S. Dollar Index doesn't have another meaningful floor again until the 93.0 area, where it hit lows several times in 2015 and 2016.
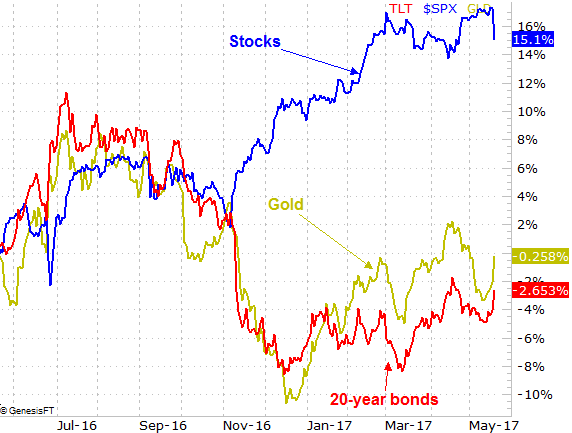
A pullback to that level would have clear and significant consequences for stocks. That falling dollar would make bonds more attractive, as well as commodities (and gold in particular). In fact, we've already seen this start to play out.
The performance-comparison chart below speaks for itself. While stocks soared since early November, they did so at the expense of gold and bonds. When stocks finally started to roll over last week at the same time the U.S. dollar did, gold and bonds rekindled uptrends that have been trying to get rekindled for a while now.
The one thing wrong with the dollar's sharp pullback and the associated plunge from stocks is the sheer pace of it. It's all unfurling at an unsustainable pace, and inviting a snapback. Just don't look for a sustained snapback either. The bullish pushback might slow the pace of the selling to more sustainable levels, but as was noted, the damage is done.