Weekly Market Outlook - The Bulls Refuse to Go Down... Again
The bulls squandered another chance to top the market over, even with the help of a bullish gap on the first day of last week's holiday-shortened trading. The sellers threatened a couple of times, but could never overcome the tailwind to stage the overdue reversal.
The end result? Once again, the overbought market became even more overbought. We just logged the fifth winning week in a row, reaching deeper into record-high territory as we did. It remains a terribly unhealthy rally, but a rally nonetheless.
We'll dissect the flaws below. First, let's run through last week's and this week's economic information. There's a lot of hard-hitting stuff in the lineup this week to preview.
Economic Data
The centerpiece of last week's economic news -- and there wasn't much of it -- was the release of the minutes from the Federal Reserve's most recent meeting. Unfortunately, they didn't tell us a whole lot we didn't already know. The Fed's governors are worried inflation is heating up, and know a rate hike is going to materialize sooner than later. We knew that a month ago though. Janet Yellen and her cohorts are working hard to remain ambiguous.
The other big news from last week was an update on last month's new home sales and existing home sales. Both are still going relatively strong, though new home sales fell a little short of expectations. The lack of inventory keeps the picture a bit obscured; would more inventory facilitate more sales? Either way, the growth here bodes bullishly.
New and Existing Homes Sales, Inventory Charts
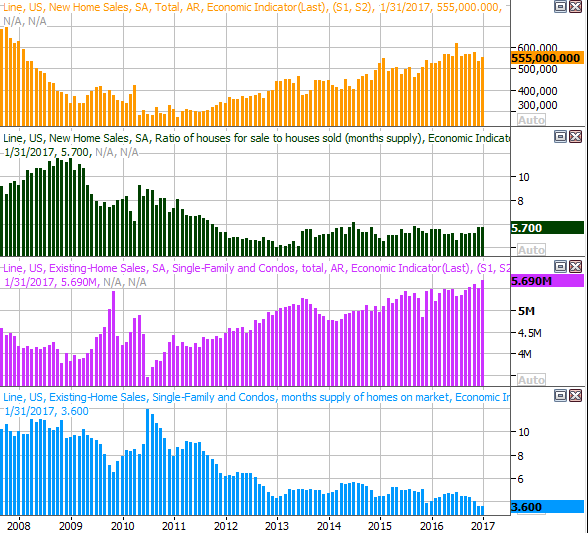
Source: Thomson Reuters
Everything else is on the grid.
Economic Calendar
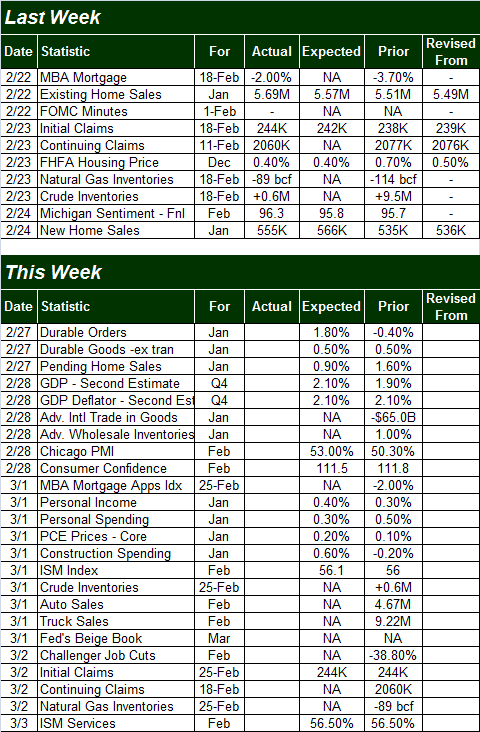
Source: Briefing.com
This week we'll more than make up for last week's modest news flow. There's more on the calendar than we can preview; we'll stick with the highlights.
The first biggie will be Tuesday's report on Q4's GDP growth rate... the second estimate. Economists have upper their growth expectations from 1.9% to 2.1%. Both are healthy numbers, moving the needle in a more bullish direction. We could certainly use a stronger growth pace here, however, especially in light of the fact that the broad growth trend is still deteriorating.
GDP Growth Chart
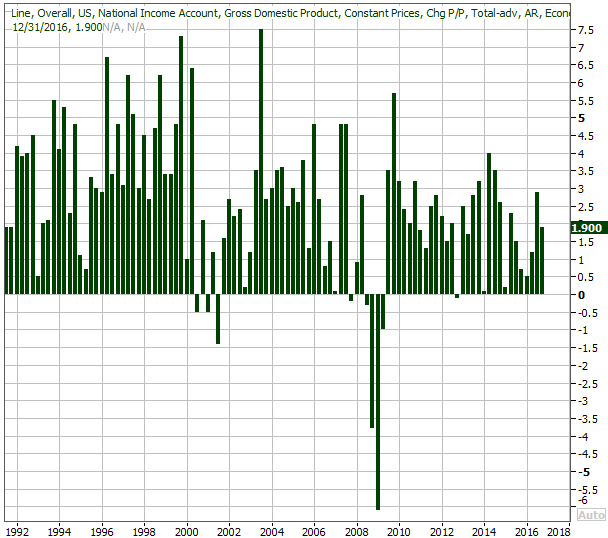
Source: Thomson Reuters
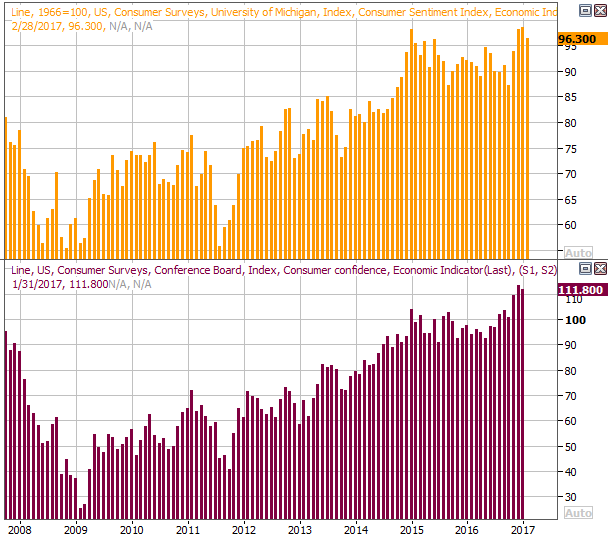
Also on Tuesday is the Conference Board's consumer confidence reading for February. Forecasters are looking for a slight dip, though the predicted reading of 111.5 is still plenty healthy. It's also clear to see that both key measures of consumer sentiment remain in strong uptrends. This lays a great foundation for growth of the United States consumer-dominant economy.
Consumer Confidence and Michigan Sentiment Index Charts
Source: Thomson Reuters
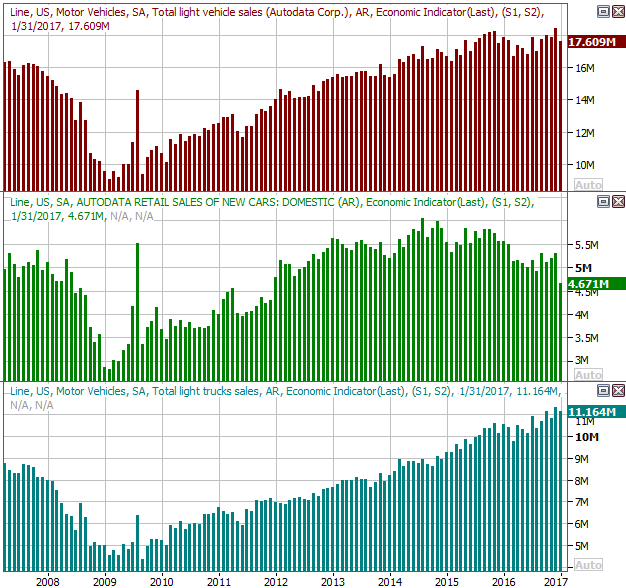
This is the week we'll hear about February's auto sales. This trend has remained robust, arguably against the odds, though car sales are suffering due to outsized demand for trucks. All the same, the 'peak auto' fear that surfaced a year ago seems to have been a bit premature. Wednesday's report will likely be a make-or-break event.
Auto Sales Charts
Source: Thomson Reuters
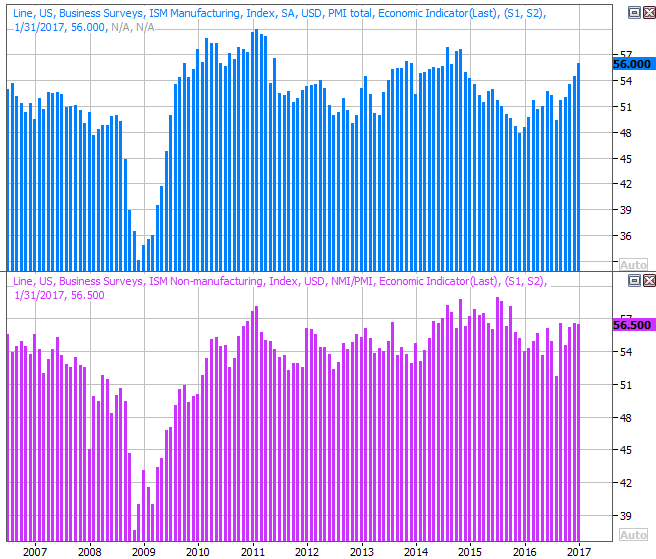
Finally, we'll get both ISM reports -- services and manufacturing -- this week. Forecasters expect February's readings to roll in right around January's levels, both of which are still above the critical 50 level. More important, both data sets are trending higher (though the services index is doing so less decisively).
ISM Index Charts
Source: Thomson Reuters
Index Analysis
The beat goes on. The market -- despite being overbought, overextended, and overvalued -- found another way to win last week. The bears took their shot, and had plenty of opportunity, but the bulls just refuse to buckle. It's still ultimately a lost cause, but kudos to the buyers for keeping the rally alive. They've played the game a lot better than the sellers have ('the game' being convincing most traders the market can't peel back).
Take a look at the daily chart of the S&P 500. The momentum is impressive. Also noteworthy is how the S&P 500 has defined a new trading range for itself, with a floor at 2353, and a ceiling at 2367. Keep a close eye on both this week. Also noteworthy is the way the VIX seems to be unable to move above its upper Bollinger band. It tried several times over the past week to punch past it, but nothing doing. The bulls are using the VIX's upper Bollinger band to keep it from launching.
S&P 500 Daily Chart

Chart created with TradeStation
With that as the backdrop, the other daily chart of the S&P 500 makes sense. That is, the PercentR line remains deep in bullish territory, and the bullish MACD is still intact. On the other hand, note the MACD bullish divergence is narrowing again.
S&P 500 Daily Chart, With PercentR and MACD

Chart created with TradeStation
As a reminder, while a move under the 80 level by the PercentR line is a red flag, it would take a lot more to give us a decided sell signal. The PercentR line would need to move below the 20 level and then stay below that level for us to assume any weakness was turning into a full-blown downtrend. Anything less, and we can just chalk it up to a little volatility and profit taking. That said...
The S&P 500 is now 8.2% above its 200-day moving average line. As you can see from the daily chart below, that's highly unusual, and a condition that doesn't last very long before a correction of the condition is made.
S&P 500 Weekly Chart
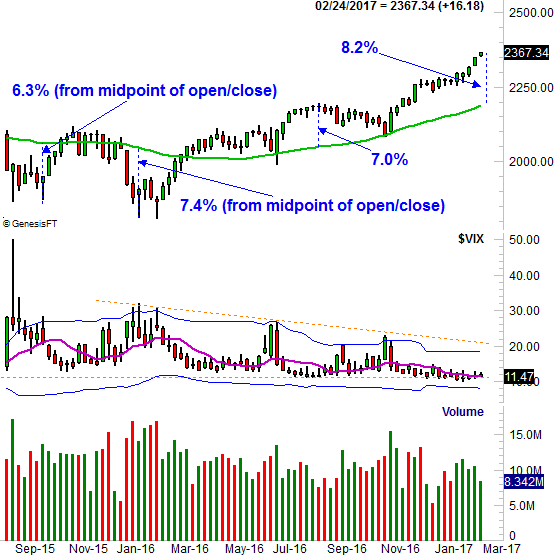
Chart created with TradeStation
And yet, we can't bet against the momentum until we have a clear reason not to, and right now, we have no reason not to. The BigTrends TrendScore for stocks was a whopping 99.1 (out of 100) last week, saying 'full steam ahead' for the rally.
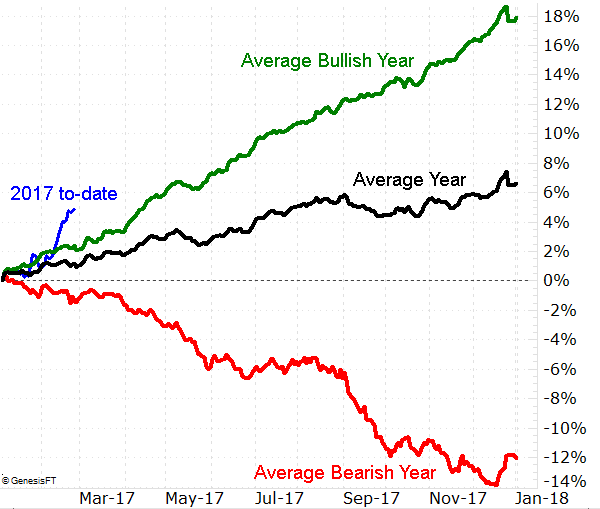
Just keep a close eye on.... everything at this time. While March is usually a good month for the market, with an average gain of 0.7%, things have been a little too good for our own good this year. Not only is the S&P 500 well ahead of the average year-to-date gain, it's well ahead of the average year-to-date gain for a bullish year.
S&P 500 Average Day-to-Day Performance Chart
Chart created with TradeStation
We have seen a few years during which we've seen bigger January/February gains, but not many. The market doesn't like outliers too often, not for very long.