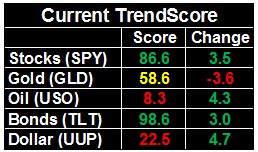
Weekly Market Outlook - The Bulls Just Won't Quit

 It's all rather amazing when you stop to think about it. The market is clearly overbought and clearly overvalued, and the bears had a chance to make the correction two weeks ago. They just didn't. They had another opening to do so on Tuesday of last week, and again, didn't. Though we know nothing lasts forever, as they say, you can't fight the tape. Until the bulls actually decide enough is enough, betting against the stampede isn't a good idea.
Just be ready for the unexpected... though that's always good advice.
We'll weight it all below like we always do. But first (also as we always do), let's run down last week's and this week's most important economic news.
Economic Data
There wasn't a whole lot to process last week. The only items of any real interest both came from the real estate front, although both gave us some much-needed rekindled confidence that housing is on reasonably firm footing.
In short, last month's existing home sales ticked up to a pace of 5.62 million, after slumping a bit in April. Inventory was static, yet remains near multi-year lows.... propping up prices.
New and Existing Home Sales Charts, with Inventory
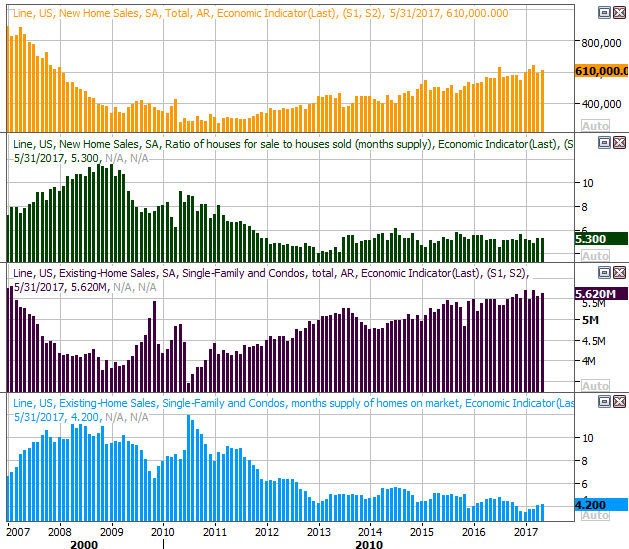
Source: Thomson Reuters
Speaking of home prices, they were up again, growing 0.7% in April according to FHFA data. We're now well into our fourth year of consecutive monthly increases, and home values -- according to the government's data anyway -- are well above 2007's peak.
FHFA and Case-Shiller Home Price Index Charts
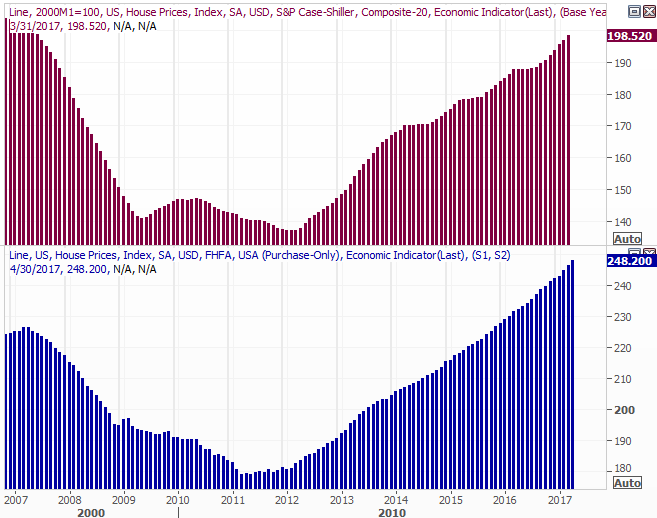
Source: Thomson Reuters
We don't have April's Case-Shiller data yet, but it's coming. Based on the momentum in place for the Case-Shiller, April's number should be another strong one.
Everything else is on the grid.
Economic Calendar
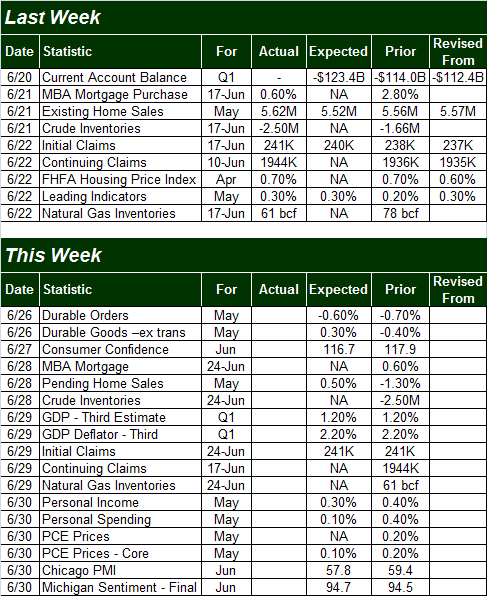
Source: Briefing.com
This week's got a few more items on the to-do list, beginning with durable orders data on Monday. We're far more curious about Tuesday's consumer confidence report; it'll be interesting to see how investors feel about the recent political warfare and how that might impact the economy. Economists are looking for a slight lull, though even if it dips from May's score, it's still plenty high at 116.7.
We'll also get the third and final reading for the Michigan Sentiment Index score for June on Friday, though it's still at strong levels as well.
Consumer Sentiment Charts
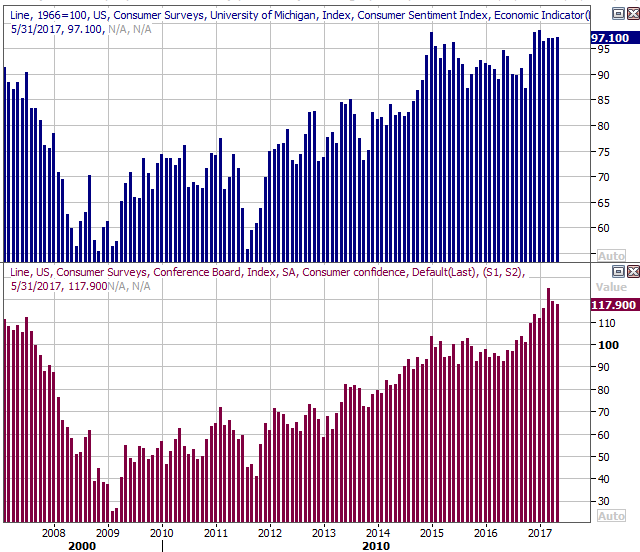
Source: Thomson Reuters
Also keep your ears open on Wednesday for last week's crude oil stockpile report, and Thursday's report on personal income and spending.
The crude oil matter hasn't been one of particular interest up until a few weeks ago... when it finally started to come down from record peak levels. Crude oil prices were already in recovery mode by that time, but that effort was augmented by a decision from OPEC to cull its production as well. Unfortunately, it's not been clear if U.S. producers are using as much discipline. With all eyes now on it, Wednesday's report could actually move the oil market a fair amount. Just bear in mind that context matters.
Crude Oil Inventory Charts
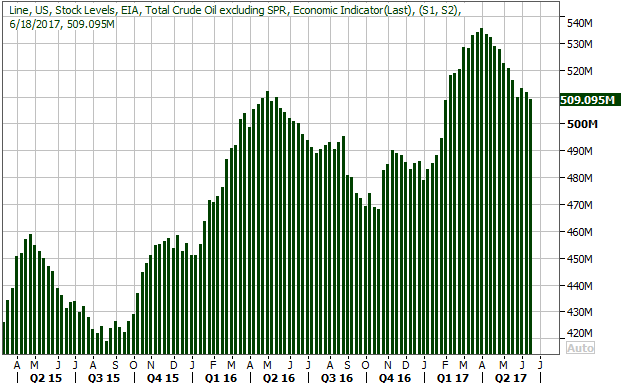
Source: Thomson Reuters
No preview chart for last month's personal income and personal spending report, but do know that analysts are looking for another step forward after pretty good progress in April. There's not a lot of room for net additions of jobs, but there is room for wage growth that also materializes in a strengthening economy. Let's hope the figures don't come up short.
Index Analysis
The unlikely rally continues. Last week, just when it looked like the weight of the post-election gains was finally going to take a toll, the bulls found a foothold right where they'd expect to find a foothold.
On the other hand, complacency is right back to its absolute-peak level. That is to say, the VIX is back to a well-established floor. For stocks to move any higher, the VIX is going to have to be able and willing to do something it hasn't done in a long, long time. It's not wrong to entertain doubts.
The aforementioned toehold -- for the S&P 500 anyway -- was the 20-day moving average line. The index peeled back from a record high on Monday, but the selling effort couldn't drive the S&P 500 under that line with the lull that took shape later in the week. As the daily chart of the S&P 500 below also shows, the VIX's close of 10.02 on Friday is just above a more absolute line in the sand at 9.5. While this encounter with the VIX's support may not exactly stop the broad rally, it certainly will slow it down (if it doesn't outright kill it).
S&P 500 Daily Chart
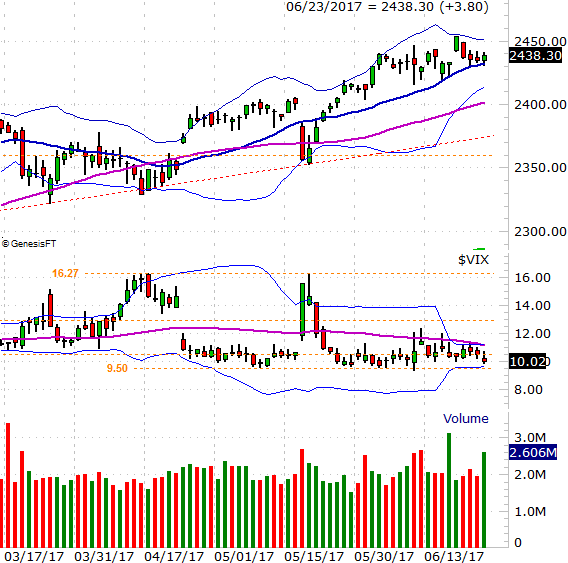
Chart created with TradeNavigator
Interestingly, the daily chart of the NASDAQ Composite doesn't look quite to toppy. For the tech-heavy NASDAQ seems to finally be drawing the kind of volume/participation it needs, and has logged a string of higher lows and higher highs last week (leading it back above the 20-day moving average line as of Friday's close. Perhaps most bullish of all here is the fact that the VXN is not at a major floor the way the VIX is. This leaves some room for the NASDAQ Composite to keep rising. The VXN's big floor is somewhere around 12.0.
NASDAQ Composite Daily Chart
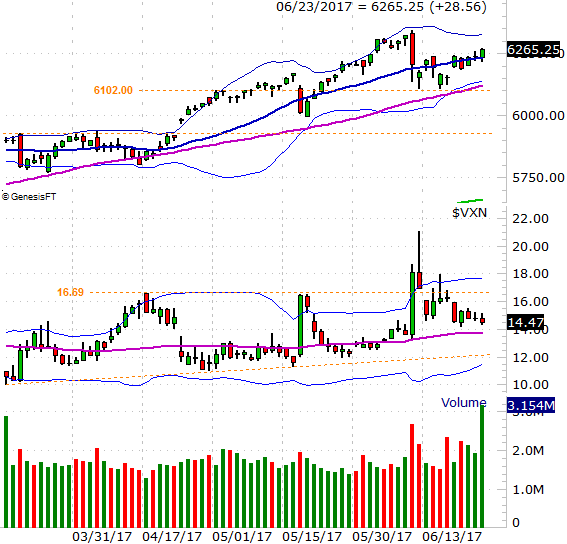
Chart created with TradeNavigator
Between the two charts, the fact that the NASDAQ looks bullish -- at least more so than the S&P 500 -- is indirectly bullish in itself. The composite tends to lead the rest of the market, and even though the NASDAQ Composite itself is being led largely by the FANG stocks and just the very top names, that's enough.
The cautiously-bullish thesis doesn't change when we zoom out to the weekly chart, though it's in this timeframe we can gain a perspective that forces us to acknowledge stocks have rallied a little too far, for too long, without a major correction. This is sustaining a headwind against the rally effort, and is reason to not take your eyes off of things... not even for a minute.
S&P 500 Weekly Chart
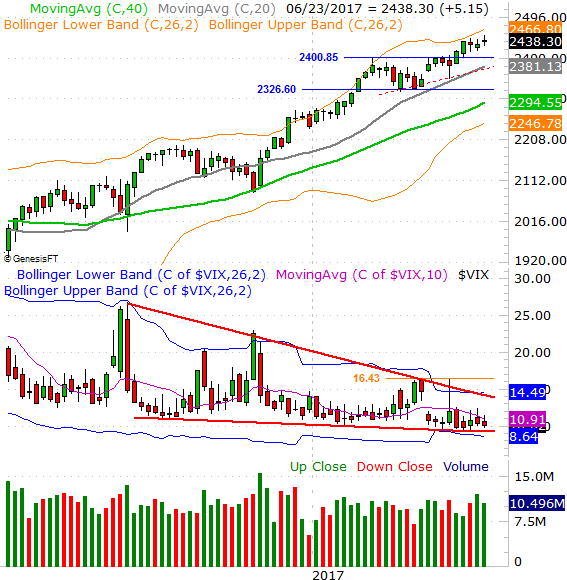
Chart created with TradeNavigator
Should any pullback materialize, there are two downside targets to watch. The first for the S&P 500 is 2383, give or take. That's where the 100-day moving average line (gray) and the line that connects all the key lows since April (that line is dashed on our chart, though a bit difficult to make out). Should that floor fail to hold the index up, the next support in around 2326. That's where the S&P 500 hit a low in April, and where the 200-day moving average line (green) should be by the time the index could test it as a floor.
That being said, perhaps the more telling red flag here would if and when the VIX snaps out of its converging wedge pattern, framed by red lines. The spring is coiled, but so far, has remain coiled. While the upper boundary of the wedge is currently at 14.0, the move that will mean something is a move above April's peak of 16.4. If such a move coincides with a break under the aforementioned support levels for the S&P 500, be afraid.
That's a very big 'if' though. As it stands right now, the trend is still technically bullish. We can't fight the tap, nor would we want to.