Weekly Market Outlook - Red Flags Don't Guarantee Anything
The bulls certainly got last week started on the right foot, ultimately leading to a move to new record highs on Thursday. There was no follow-through on Friday though, suggesting the market was only interested in reaching the milestone rather than using it as a springboard. Or, maybe traders were simply hesitant to keep buying in front of a three-day weekend... one that was rife with geopolitical tensions.
 Whatever the case, anything could be in the cards as the new, shortened trading week begins. Don't dig in too deep on either side of the fence.
We'll weigh the bullish and bearish arguments below, as always. First though, let's look at last week's economic news and preview the massive wave of economic announcements in the pipeline for this week.
Economic Data
Last week wasn't a terribly busy week in terms of economic news, but we did get a couple of items worth dissecting.
One of them was the home sales reports for April... new as well as existing. The former was disappointing, while the latter was just ok. New home sales fell from a pace of 642,000 (a multi-year high) to only 569,000, while sales of existing home sales slumped from 5.7 million to 5.57 million. Both fell short of expectations. Still, the broad trend remains a bullish one.
New, Existing Home Sales (With Inventory Levels) Charts
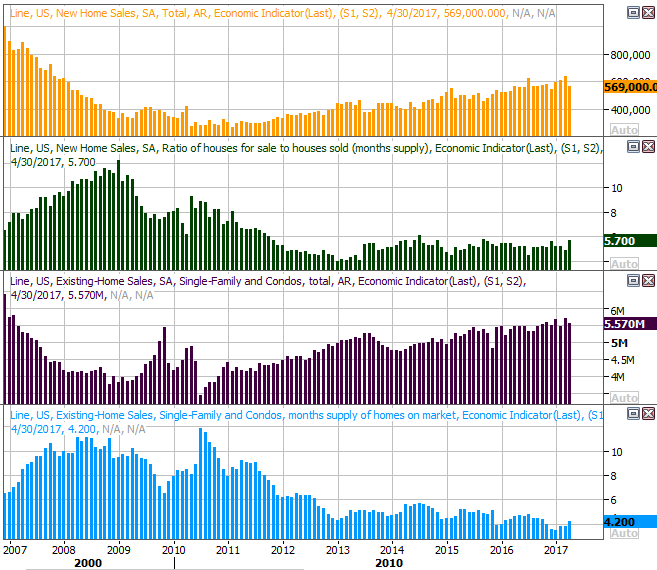
Source: Thomson Reuters
The other item worth exploring was last month's durable orders, which fell rather dishing out the expected advance. One slow month doesn't break the bigger-picture uptrend, but another bad month could call it into question.
Durable Goods Orders (with and without transportation) Charts
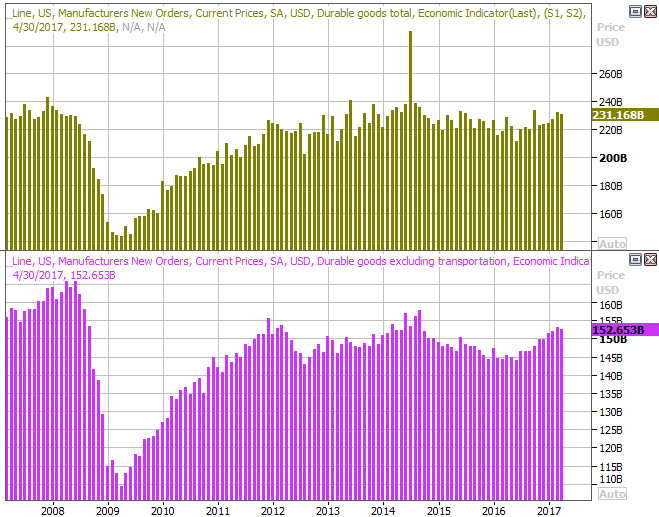
Source: Thomson Reuters
It wasn't a stellar week for the economy, though the lackluster news was at least partially offset by the second (of three) revision to the first quarter's GDP growth rate. Economists ratcheted up its estimate from 0.7% to 1.2%; the second estimates isn't altered much by the third and final estimate (if changed at all). Still, all in all last week as a bit of a downer.
Everything else is on the grid.
Economic Calendar
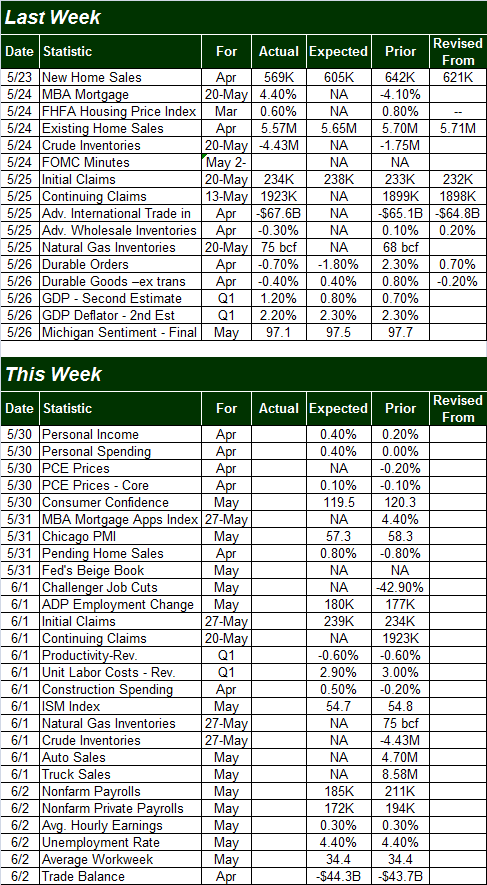
Source: Briefing.com
This week is going to be almost annoyingly busy, with all of crammed into just four trading days.
The biggie, of course, will be Friday's employment report for May. Analysts expect to see 185,000 new jobs created, down from April's 211,000. Just bear in mind April's strong reading blew estimates away. Whatever the case, that isn't expected to be enough to move the unemployment rate needle from its already-quite-low level of 4.4%. The real litmus test for the jobs market's health from here will come on the wages front, which are expected to rise another 0.3%. Tuesday's personal income and spending report should provide something of a preview on that front.
Unemployment Rates and Job Growth Charts
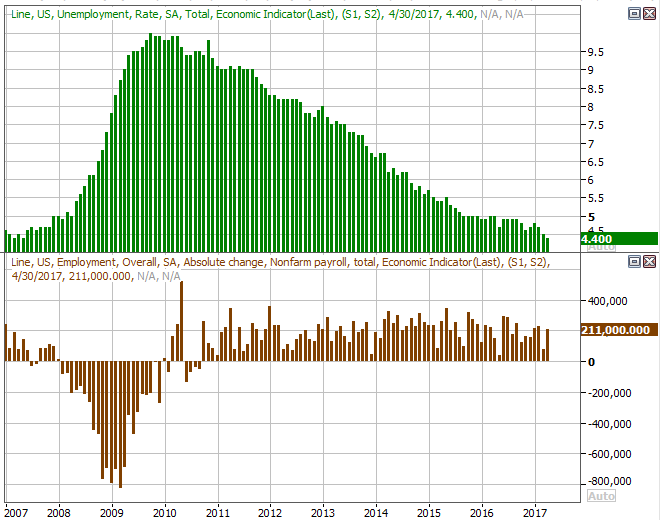
Source: Thomson Reuters
Before we hear about last month's jobs situation though, on Thursday we're going to hear about May's car sales. You may recall last month's automobile sales activity not only came up short of expectations, but rolled in markedly lower than March's levels. In fact, it's getting increasingly difficult to say "peak auto" hasn't already happened. Thursday's news could save or outright break the automobile industry's stocks.
Automobile Sales Charts
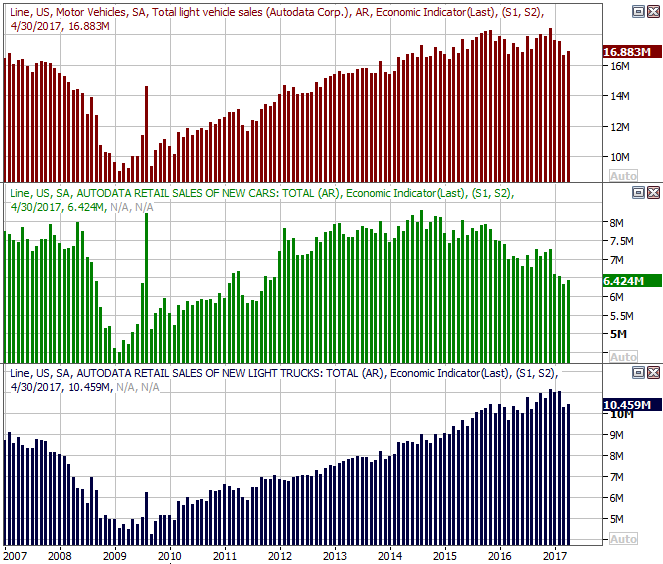
Source: Thomson Reuters
Finally (though it's actually the first one we'll hear about), keep your ears open on Tuesday for the Conference Board's consumer confidence reading for May. We learned last week that the Michigan Sentiment Index was about the same in May where it ended March and April. Though both are at strong levels, neither are at levels that leave much -- if any -- room for upside. If optimism is "maxed out," so too may be stock prices.
Consumer Sentiment Charts
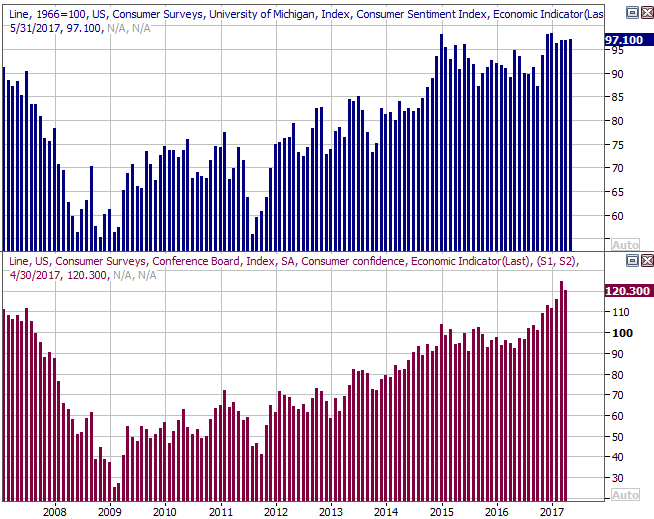
Source: Thomson Reuters
Index Analysis
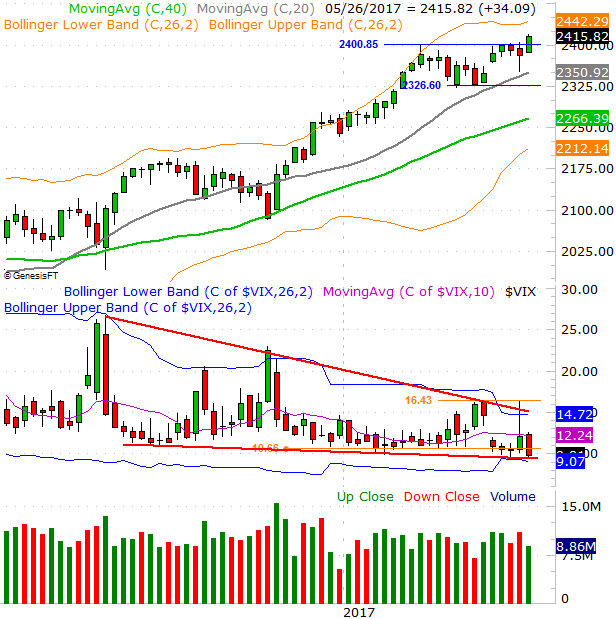
In retrospect, last week's advance comes as no real surprise. It was simply an extension of the reversal we saw take shape two Thursday's ago -- the day after the Comey/Trump brouhaha materialized and up-ended stocks -- and repeated a pattern we've become all too familiar with. That is, the VIX hit a peak and the S&P 500 bumped into its lower Bollinger band.
S&P 500 Daily Chart
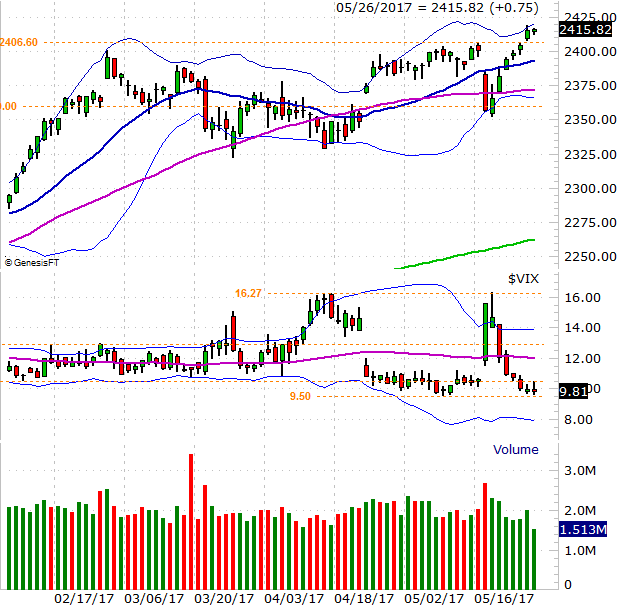
Chart created with TradeNavigator
To that end, there IS room for more upside. The VIX is drifting lower, and the VIX's lower Bollinger band (a key floor) is well below the VIX's present value. And, last week's bullish thrust from the S&P 500 qualifies as a breakout move... a break above an established technical ceiling at 2406.6.
It's anything but an ideal rally scenario, however.
For starters, while the VIX's lower Bollinger band may be less than its current value, there does seem to be something of a floor at 9.50 that could put a lid on the bullishness. And, though the S&P 500 mustered a legitimate breakout move on Thursday, it also left behind a gap when it did so. Traders may try to fill in that gap this week, but once (if) that happens it could be interpreted as a sign that a bigger pullback is in the cards. [If traders think one is coming, they'll create the selloff they fear.] Perhaps more than anything though, the waning bullish volume we've seen over the course of the past seven trading days suggests the higher the market goes, the less interested the bulls are.
It's entirely possible Friday's tepid volume had more to do with the approaching three-day weekend than it did a lack of bullish interest. Even before Friday though, the buying interest was deteriorating.
The daily chart of the NASDAQ Composite doesn't tell a story that's any different.
NASDAQ Composite Daily Chart

Chart created with TradeNavigator
Usually zooming out to a weekly chart of either index provides a little more perspective on an otherwise-mixed message. Not this time though. This time, the longer-term point of view makes matters even more confusing.
It's on the weekly chart of the S&P 500 we can see how healthy last week's breakout thrust was. After consolidating in a sideways range between 2326 and 2401 for a while, the bullish move is unfurling on a pretty solid technical base. It's also in this timeframe we can see the index has yet to bump into its upper 26-week Bollinger band, which has been the key ceiling that's kick-started most of the major pullbacks since early 2016 (albeit not very quickly in some cases).
S&P 500 Weekly Chart
Chart created with TradeNavigator
On the flipside, it's also on the weekly chart of the S&P 500 we can get a sense of just how uncomfortably low the VIX is relative to its long-term history. In fact...
While the momentum may be technically bullish -- with room left for more bullishness -- a couple of concerns surface with a look at the weekly timeframe. Namely, it's on this chart we can see the VIX is trapped in a descending wedge pattern [framed in red]. That's bearish for the VIX as long as it remains in the confines of the wedges' boundaries, but we know sooner or later the VIX is going to bust out of that wedge's upper ceiling. When it does, a whole lotta pent-up "up" for the VIX is going to come pouring out, and that's going to work against stocks.
To that end, it's also clear from the longer-term chart that while the momentum is impressive, we've gone a little, or maybe a lot, too long without a major corrective move. That will make the next corrective move a painful one once it does materialize.
First things first though. In the meantime, the S&P 500's got a rather strong support level in place around 2370, and the VIX's short-term ceiling at 16.3 is still intact. Until both of those lines are crossed, we can't afford to assume bearishness is inevitable.