 The bulls mustered another victory last week... the fourth in a row for the S&P 500, and the twelfth winning the for the past seventeen. Thanks to last week's 0.66% advance, the index is now up a shocking 14.3%.
That being said, the sheer size of the gain is now proving to be a burden on the rally effort; a couple of bullish gaps left along the way aren't helping either. There's a big red flag, however, that only waves when you take a step back and look at the longer-term weekly chart (we didn't really notice it until this week).
We'll dissect it all below. First, though, let's look at last week's and this week's key economic data.
Economic Data
Last week was super-busy in terms of news; we'll stick with the highlights. In order of appearance (mostly)...
Investors who were hoping the economy grew more in the fourth quarter than initially thought were disappointed. The pros were calling for a second reading on Q4's GDP growth of 2.1% -- up from the first reading of 1.9% -- but there was no change. It's a concern simply because much of the recent buying was predicated in the assumption that even before Trump took office the mere prospect of his pro-business policies were taking hold in the last couple of months of last year.
GDP Growth Chart
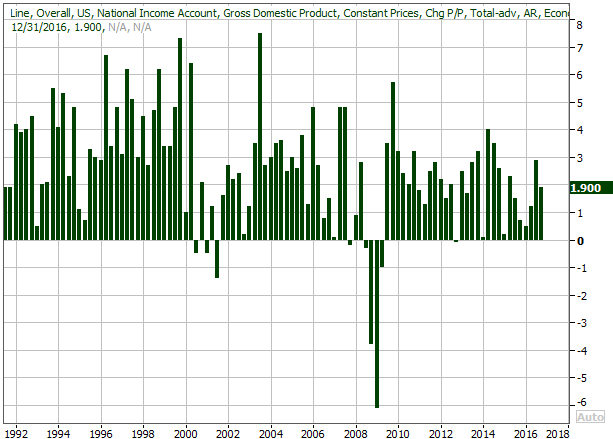
Source: Thomson Reuters
As further evidence of those high expectations, last month's consumer confidence reading was another big number.... 114.8, when all was said and done. That was well above expectations, and as you can see, the Michigan Sentiment Index is showing a comparable level of optimism. [One can't help but wonder, though, if expectations are so big that they're a bit unhealthy.]
Consumer Confidence and Michigan Sentiment Index Charts
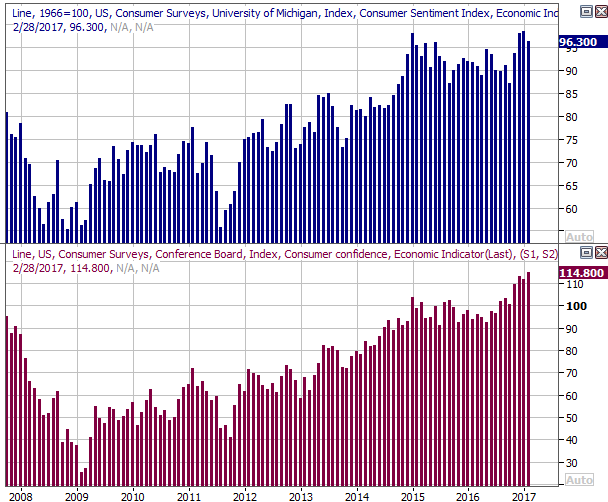
Source: Thomson Reuters
We also got February's auto sales data this past week. It was good for trucks. It wasn't so good for cars. Overall though, the automobile heyday is still firm. And yet....
... when you look at the overall trend since late-2015, there's no sequential growth, and there's not a whole lot of year-over-year growth in the total sales pace. All of a sudden the notion of 'peak auto' is becoming a concern again, even if it doesn't necessarily mean the pace is going to start shrinking.
Auto Sales Charts

Source: Thomson Reuters
Also know that February's buyer-incentives to car buyers was a whopping 10.2% of the average transaction price, which is the biggest February figure since 2008. This demand may be quite artificially driven.
Last but not least, we heard February's ISM data last week. Both the manufacturing index and the services index were up, and better than anticipated. This is very encouraging in light of the 2nd estimate of Q4's GDP growth, suggesting things have perked up "in the meantime." Then again, bear in mind that the ISM data is an opinion poll, so all these business managers may be feeling good based on what they feel rather than actual growth numbers they're experiencing. Still, they've been rising for a while. There's got to be at least a small reason.
ISM Index Charts
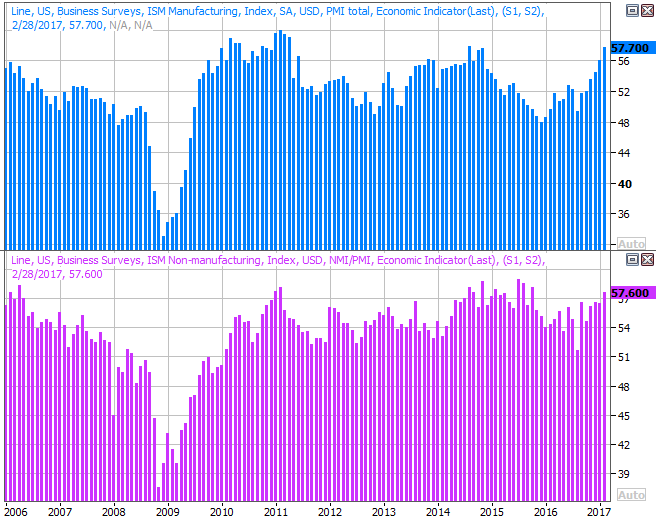
Source: Thomson Reuters
Everything else is on the grid.
Economic Calendar
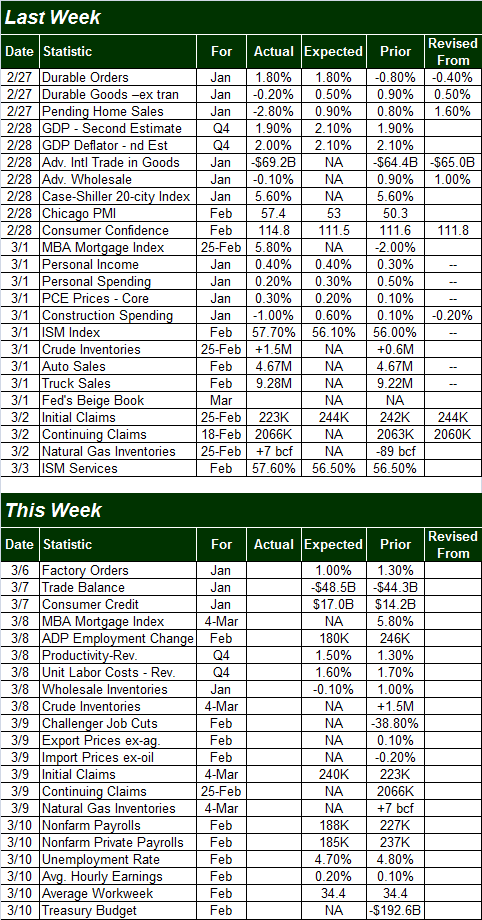
Source: Briefing.com
This week won't be quite as busy, but there is one HUGE data set on the calendar -- February's unemployment report.
As of the latest look, economists expect the unemployment rate to fall from 4.8% to 4.7% on the heels of 185,000 new jobs. That job-growth pace is less than January's 237,000 new payrolls, but bear in mind that January's total growth was much more than expected. We could see another big beat, particularly in light of all the employment activity President Trump has all but mandated.
Unemployment Rate and Payroll Growth Charts
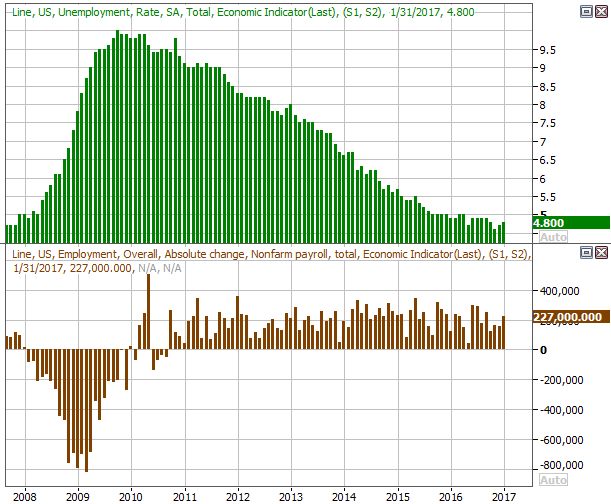
Source: Thomson Reuters
The real litmus test for employment will be wage growth; the number of people with a job is at or near maximum capacity. From here we want to see employers starting to pay more competitively.
Index Analysis
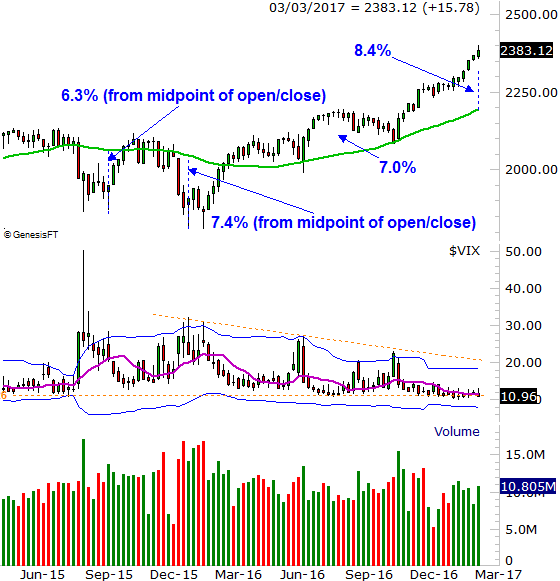
The past four months have been nothing less than amazing. The 14.3% advance since the beginning of the first full week of February is one of the fastest ever for the market, carrying it deep into record-high territory.
The move, of course, has raised eyebrows simply because of its speed and distance. The S&P 500 is now 8.4% above its 200-day moving average line (green), and there's something else... the volume behind the rally hasn't been great. It hasn't been bad, but one would expect to see growing volume on the way up if it's to last. More and more buyers are any rally's lifeblood. The buyers may be unwilling to step in with the market this overbought and this overvalued.
S&P 500 Weekly Chart
Chart created with TradeStation
Zooming into a daily chart of the S&P 500 we can get a better fell for what's not quite right about the rally. We've now left three gaps in the advance's wake... two of them materializing in just the past couple of weeks.
S&P 500 Daily Chart
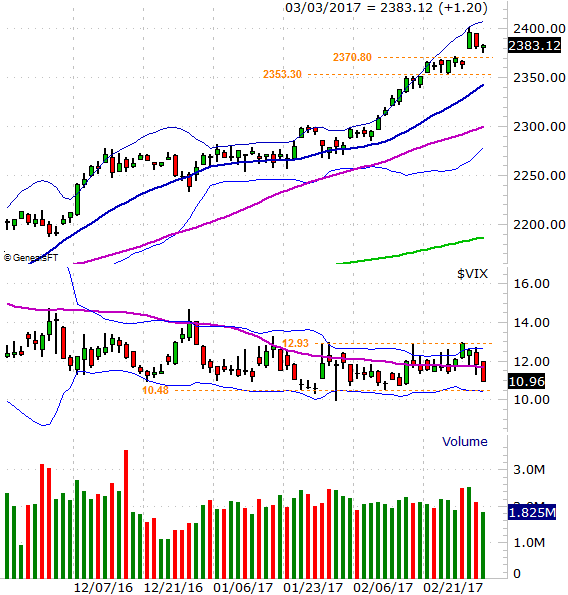
Chart created with TradeStation
This is a tricky situation. As they say, the trend is your friend.... until it isn't. The current trend is bullish. Even though the BigTrends TrendScore for stocks fell quite a bit last week, at above 90, it's still a very strong reading. The question is, how long can it possibly last?
There's no easy answer to the question. But, we will caution against assuming things that seem unlikely won't likely happen. The Dow's move to 20,000 seemed unlikely at the time, and we're now above 21,000. Never say never.
On the flipside, it pays to be prudent, and it would be naive to ignore the possibility of a pullback here. And, in this case, once a bearish ball gets rolling, it will be very difficult to stop - there's just too much profit-taking potential to dismiss it. The keys were (and still are) the S&P 500's break below the 2353 level, and the VIX's break above 12.9. Even then, however, the lower 20-day Bollinger band currently at 2277 will be the make-or-break level should any selloff get started in earnest. Anything else, and we have to assume the bigger trend remains intact.
The alternative bearish signal will be a PercentR line that gets and then stays below the 20 level.
S&P 500 Daily Chart, With PercentR and MACD
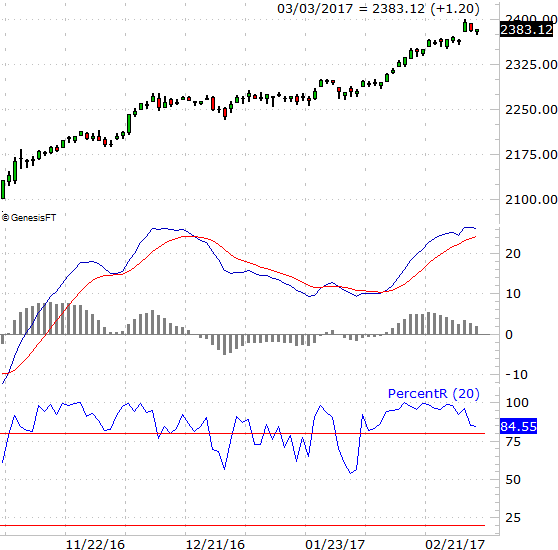
Chart created with TradeStation