Weekly Market Outlook - Friday Wasn't a Death Blow to the NASDAQ (Yet)
Last week wasn't an award winning week in terms of the size of the gains stocks managed to reap, but anytime the market is pushing its way into record-high territory is pretty good week.
 Still, it would be naive to think the rally isn't on borrowed time. Aside from being technically overbought and fundamentally overvalued, complacency is at dangerous levels. It won't matter until it matters, but it's going to matter sooner or later.
We'll slice and dice it all below, but first let's take a look at last week's and this week's economic news. It serves as the underpinnings of what's driving the market.
Economic Data
Last week was relatively boring in terms of economic announcements. The only items of any real interest were the ISM Services Index (we got the ISM Manufacturing report the week before), and what ended up ending a surprise build up in the nation's stockpiled crude oil.
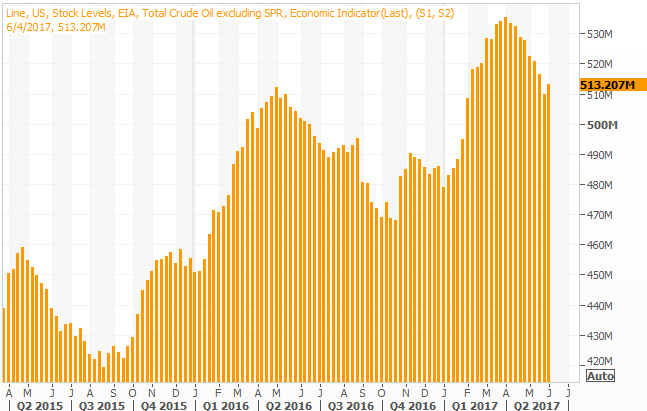
Crude oil prices had been inching their way higher for a few weeks now, partly because OPEC was sticking to its promise to cull output, and partly because the amount of oil stored in the U.S. was being drawn down. Shrinking the glut will help boost prices -- supply and demand. That downtrend was halted last week, not in a big way, but in a startling way. Reserves grew from 509.9 million barrels to 513.2 million, calling into question just how much output has been curbed.
Crude Oil Stock Level Charts
Source: Thomson Reuters
As for the ISM Services Index, it fell a bit last week, but at 56.9 remains above the key 50 level. The same for the manufacturing version of the data. That said, we'd like to see both broadly on the rise, as that tends to correlate with meaningful economic growth.
ISM Services and Manufacturing Charts

Source: Thomson Reuters
Everything else is on the grid.
Economic Calendar

Source: Briefing.com
This week is crammed full of economic news, so we'll only be able to preview the highlights.
The party starts on Tuesday with last month's look at producer inflation, but that party extends to Wednesday when we'll hear about May's consumer inflation. Both have been pushing higher, and while the pace of inflation growth is expected to slow, it's still moving higher. With annualized rates now at or above the Fed's target levels, the FOMC will be hard pressed to not raise rates when it has a chance to this month....
Consumer and Producer Inflation (Annualized) Charts
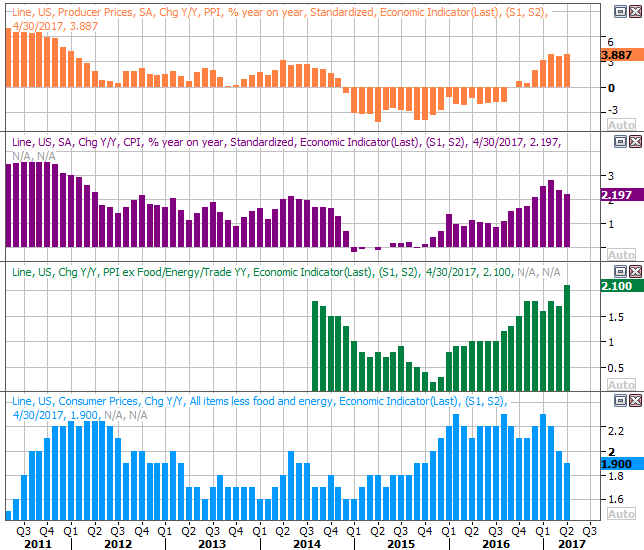
Source: Thomson Reuters
.... a rate hike that will likely materialize on Wednesday afternoon, by the way. Pros and traders have priced in a 98% chance the Fed funds rate will move 25 basis points higher that day.
Last month's retail sales data will be released on Tuesday, and analysts expect respectable growth in spending after a very strong April report. As has been noted of late, consumers are doing their part to get the economic engine into a higher gear.
Retail Sales YOY Growth Charts
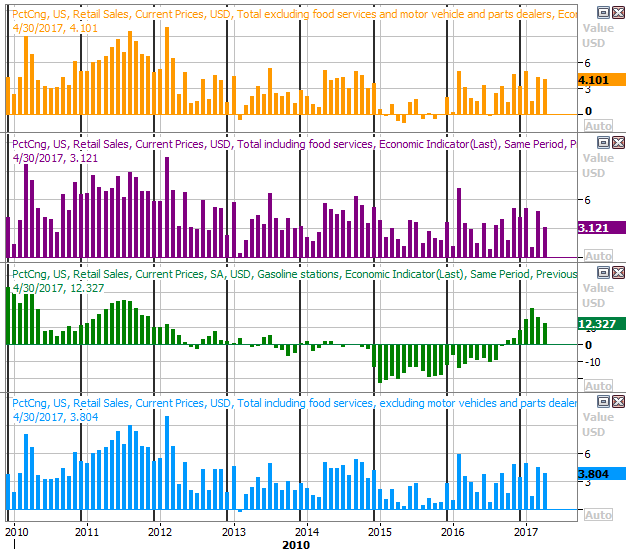
Source: Thomson Reuters
Also note that last week's crude oil stockpile tally will be posted on Wednesday, either confirming oil companies are once again over-producing, or suggesting last week's rise was just a blip.
Thursday's highlight is the release of May's capacity utilization and industrial productivity data... one of the best indicators of economic health. Unfortunately, economists aren't looking for any change whatsoever, deflating the hope we'd seen from slightly improved numbers in recent months. Perhaps the low expectation will set up a bullish response to better-than-expected numbers, though we can't count on that happening.
Industrial Productivity and Capacity Utilization Charts
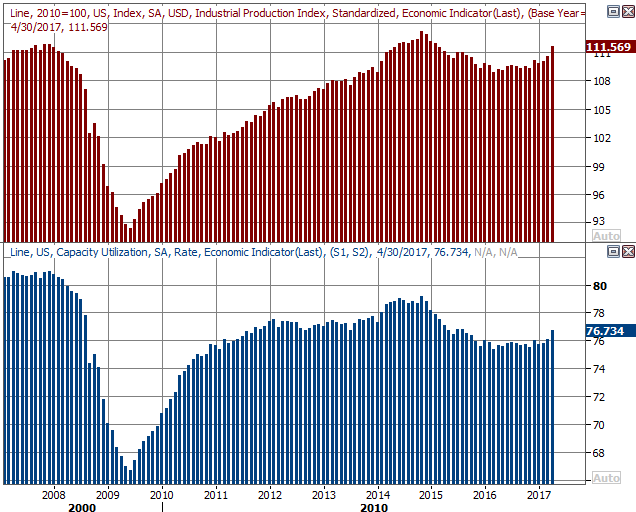
Source: Thomson Reuters
Finally, on Friday we'll get last month's housing starts and building permits numbers. This was one of the economy's brightest spots for some time, but has been lackluster of late and downright negative for April. We could use a pleasant surprise here -- the pros aren't looking for a whole lot of forward progress.
Housing Starts and Building Permits Charts

Source: Thomson Reuters
Index Analysis
The best way to describe last week's action is suspiciously unusual. The NASDAQ was down by more than a little bit after tiptoeing into new-high territory, and the VXN popped. The S&P 500 mostly held its ground though, and the VIX remained steady. It's a worry simply because the NASDAQ leads and the S&P 500 follows. If the tech-heavy (and market-favorite-heavy) NASDAQ is struggling because the overbought leaders are finally starting to hit a profit-taking headwind, all investors may take that as a cue to head to the sidelines.
And that IS what's happening here. On Friday, the FANG stocks and tech giants that traders love to love were all up-ended... a lot more than the NASDAQ Composite was. The color-coded chart below illustrates this idea quite clearly.
Major Technology Stock Performance vs. NASDAQ Chart
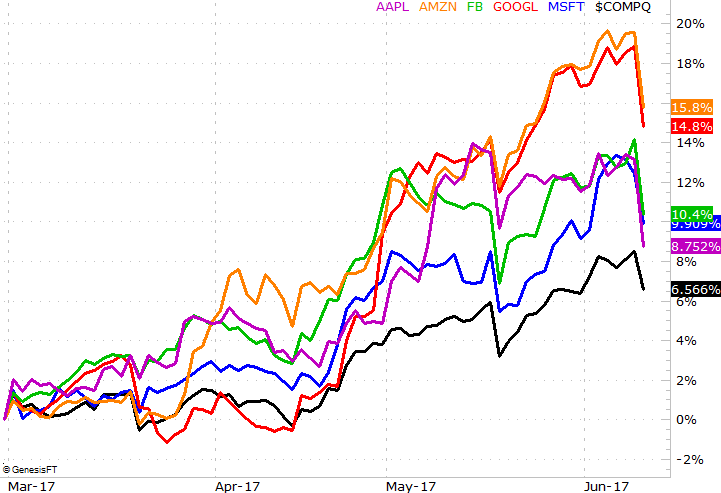
Chart created with TradeNavigator
This isn't necessarily the beginning of the bubble's pop, but this is what it would look like if it was the beginning of the reversal.
With that as the backdrop, the sharp and sudden bearish swing of the NASDAQ on Friday now makes a lot of sense, as does the VXN's surge. Perhaps more important, for the first time in a long time the selloff was on high volume. And yet, when all was said and done the composite still managed to claw its way back above the 20-day moving average line on Friday.
NASDAQ Composite Daily Chart
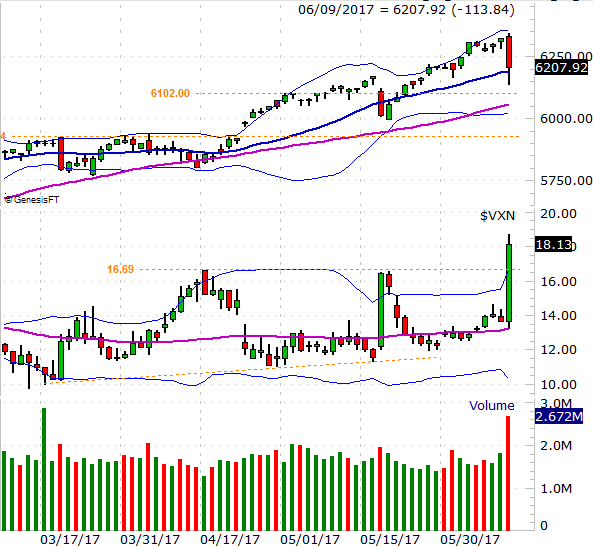
Chart created with TradeNavigator
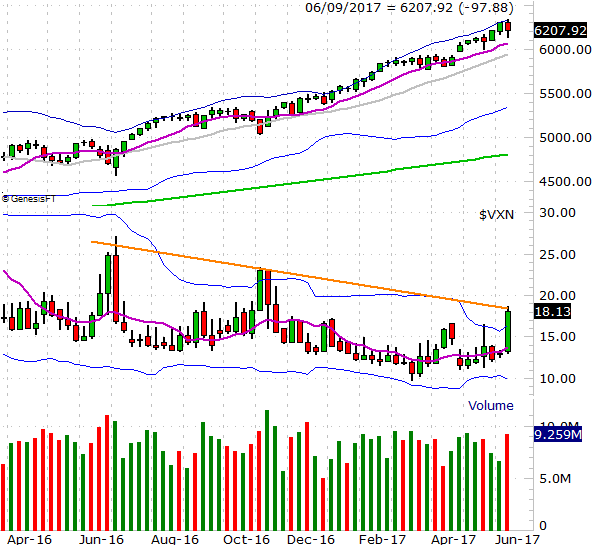
Still, there's little doubt that this is the best shot the bears have had in a while to get the pendulum swinging in the other direction again. On the weekly chart we can see the VXN is testing a major long-term ceiling. We can also see how long the NASDAQ has rallied without a corrective move, and how overextended it's become as a result.
NASDAQ Composite Weekly Chart
Chart created with TradeNavigator
Here's the curios part... the S&P 500's chart doesn't really look like the NASDAQ's.
Take a look. The S&P 500 ultimately held its ground on Friday after a rather volatile session. The VIX looks like it was rebuked when it tried to move above its 50-day moving average line (purple).
S&P 500 Daily Chart
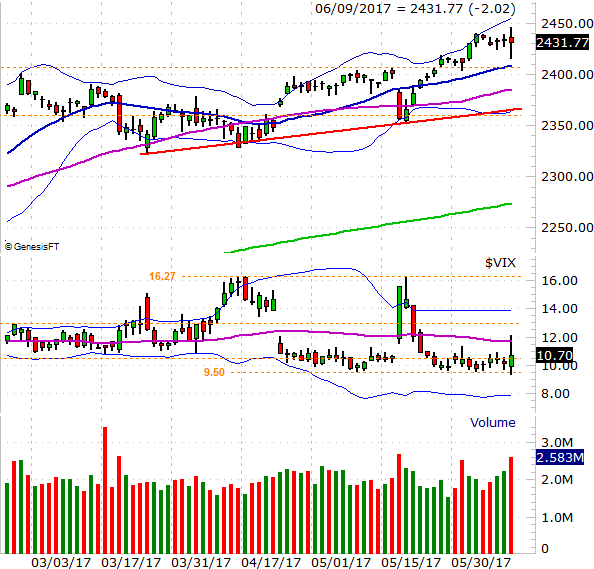
Chart created with TradeNavigator
So what are we supposed to make of it? Not that the market hasn't been a "keep your eyes peeled" situation for a while now, but it's even more so after last week. The good news is, we know what to look for. They were all discussed above.
Odds are good that sooner or later the S&P 500 and the NASDAQ will sync up again. The question is, where? On the bullish side of the fence, or the bearish?
For the NASDAQ, it's a little too soon to worry. If the VXN gets comfortable above its falling resistance line at 18.2 and the composite pulls under an entanglement of support around 6050, that's trouble for the market. It will be even more troubling if the S&P 500 at the same time falls under a bunch of support around 2365 and the VIX finally moves above 16.3. Anything less, and it's all just a little volatility.
And, whether we like it or not, "buy on the dip" has been the mindset for months now. There's nothing about last week's action to suggest that's actually changed. Just keep in mind Friday's selloff from the tech sector was a high volume selloff, which could POSSIBLY mean the psychological undertow has changed.
Realistically speaking either way though, the odds of at least a small pullback to the aforementioned support levels seems more likely than not. We'll have to reassess then.