Last week we pointed out how utilities stocks - a market safe-haven - were exhibiting some amazing strength while everything else was falling apart. It was a hint that investors were thinking a pullback was looming, and if they're thinking it, they may well eventually make it happen.
The thesis turned out to be right too, for the day and a half following the Thursday afternoon we posted the possibility. Stocks tanked in earnest on Thursday, and followed through on Friday.
Monday's action of course called the idea into question, with utilities taking a back seat and technology stocks leading the bullish way. That's a sign of a "risk on" mentality. For a short while on Tuesday it looked that that was the new shape of things to come... a bullish revival. By the end of Tuesday's session though, the broad market was on its heels again, and (check this out) utility stocks were the one bright spot. [Utility stocks are marked by the peach-colored line on our comparative representation.]
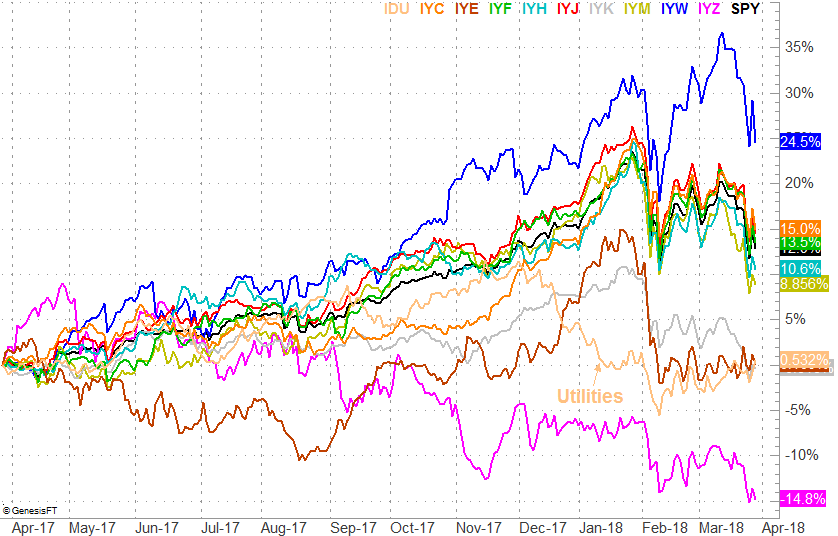
Seeing this dynamic once again points to a bearish mindset; traders are looking for safety, and they're shedding risk.
What's interesting about the whole thing is the interplay of the key indices, and the S&P 500 in particular, with its 200-day moving average line.
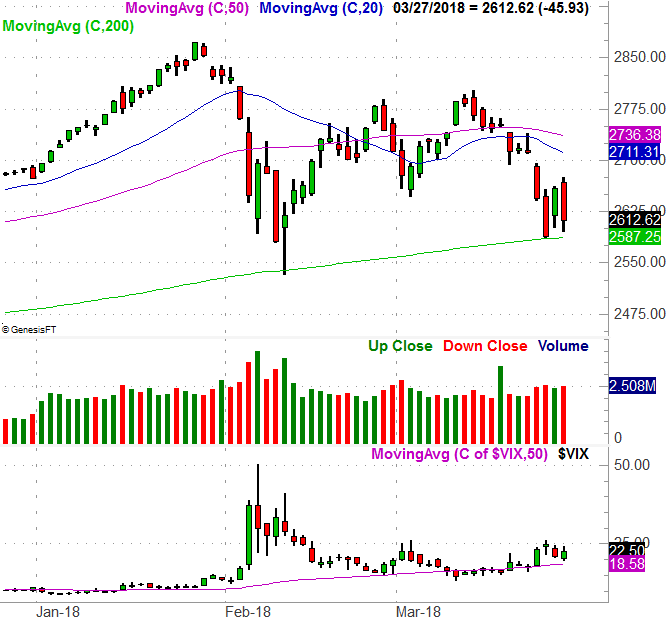
Take a look at the daily chart of the S&P 500 below; the green line is the pivotal 200-day moving average line. All it took was a kiss of it on Friday to bring the selling effort to a halt. It turns out that was even the Launchpad for a rebound effort on Monday. It wasn't an effort built to last though. Tuesday's action almost turned into a bearish engulfing bar - engulfing Monday's bar - and dragged the index to within striking distance of a break back under the 200-day moving average line.
Yes, the 200-day line prompted two bullish reversals the last two times it was tested. The bears keep attacking it though. If they continue to do so, it'll eventually break down as a support level. If and when that happens,
Also notice that the amount of volume we're seeing on the down days is robust, and rising.
Bottom line? One red flag is already waving, and another is on the verge. That's the strength in the market's safest sector, and the approach to the 200-day line, respectively. The clinchers will be a break below the 200-day moving average, and if the VIX pops above its recent ceiling at 26.0.
Sit tight, and just know that the bulls are the ones who have something to prove here. They have a headwind they'll have to overcome.
The irony is, this weakness is developing at a time when stocks are supposed to be bullish. April is one of the best months of the year, and March is supposed to be pretty bullish as well. When they're not as bullish as they normally are though, they tend to be really, really bad performers. And one more bad day could open the floodgates.