Risk On! Sector Rotation Says Traders Are Shunning Safety For Aggressive Growth
The broad market's rising tide did most of the heavy lifting. But, the rising tide didn't lift all boats equally. Traders have been pouring into lagging names of late, at the expense of safety and value. Although stocks as a whole are ripe for a little profit-taking, if this is the shape of things to come, traders would be wise to prioritize some groups over others.
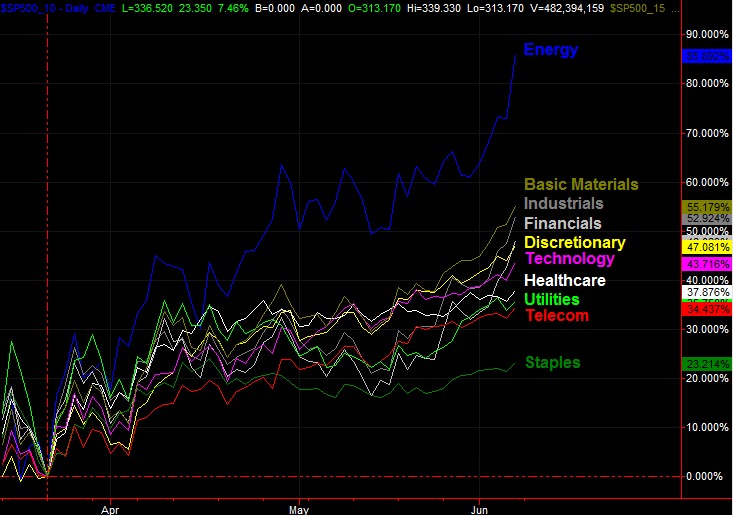
The chart below tells the tale. After a drubbing in February and March, energy stocks -- in step with crude oil prices -- are soaring. They've gained 86% since the March 23rd bottom, nearly doubling the next-best performer. That next-best performer is the similar basic materials sector with its 55% advance for the past two and a half months. Both sectors are accelerating, but so too are the industrial names... one of the surprises of late. They'd been lackluster coming out of the March lull, with COVID-19 crimping factory activity as well as demand. Things aren't quite as troubled as they seem to be, given last week's impressive payroll growth.
Beyond that, financial stocks and then discretionary stocks are in fourth and fifth place, respectively. In sixth -- and this is interesting -- is the technology sector with a 44% rebound from its March low. These names include most of the FANG stocks, which have been leading the broad market for most of the past couple of years. Not this time though. The tech sector has just been so-so coming out of the March bottom , as it's not being led by the biggest and most important names in the group. FANG fatigue? Possible. After that comes healthcare, with a seventh-place 38%. Hope for a quick solution to the coronavirus isn't enough to keep these names moving.
The bottom three performers are interesting in their uniformity. That's utilities, then telecom, then staples, with gains of 36%, 34% and 23% (respectively) since late March.
There's a common element among them. They're all safe names. They're mostly value names too, reflecting their reliability that tends to make them value-type tickers. Traders are clearly more interested in taking risky swings on beaten-down areas than they are in holding onto more proven stocks. Again, if this is the shape of things to come, the disparity is wide enough that it matters to performance-seekers.
As red hot as energy names have been, they look particularly vulnerable to profit-taking. But, don't jump to conclusions. These stocks are completely shellacked in late-February through mid-March. They had and have a ton of room to recover. It's just a question of conviction, and the backdrop. More progress on the COVID-19 front will inspire confidence that leads to even better oil prices.
Most interesting about the chart is how well utilities stocks, as weak as they may be compared to the overall market, are making better progress than telecom names. Also notice the financial stocks that had been dragging the bottom for weeks bolted higher over the course of the past few days. That's the result of the realization that the economic fallout from the coronavirus outbreak isn't as devastating as first presumed.
This performance comparison chart is interesting, but actual buy or sell signals are usually rooted in crosses of these lines. That's a sign of relative acceleration or deceleration.