Oil is On the Verge of a Meltup That Could Shock the World
The third week of crude oil's rally isn't exactly going to finish on a high note. But, we're still ending with a solid weekly gain. The bulls just need to take a breather. We're still in breakout mode. In fact, though odds are good we'll see some profit-taking in oil in the near future, there's more for the bulls to be excited about now than we've seen in years.
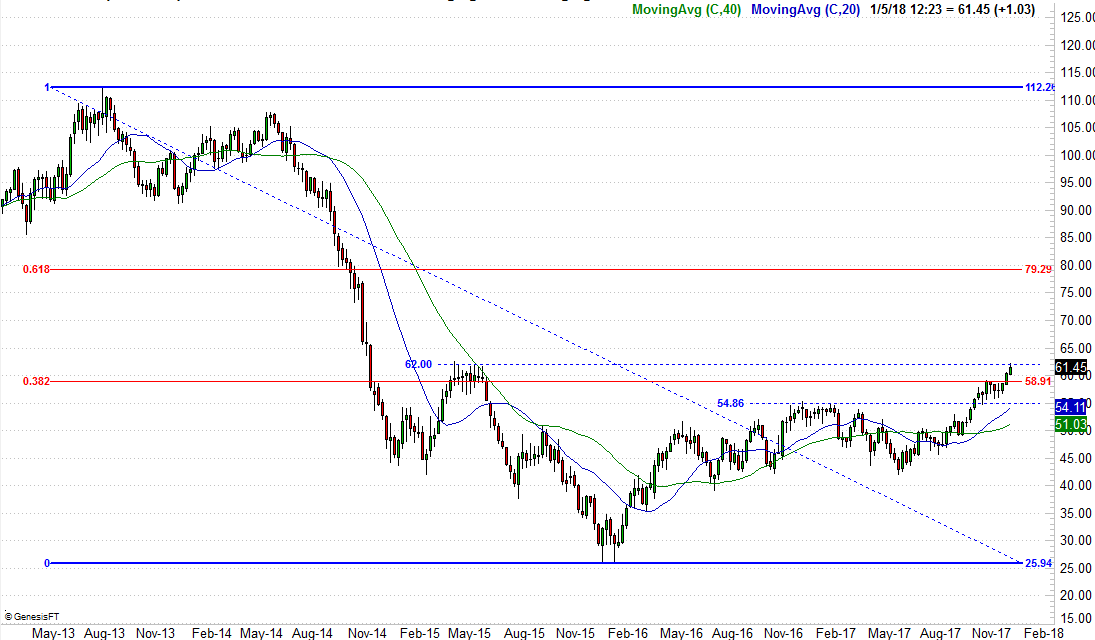
The unexpected rebound in oil prices is one we predicted as far back as September, when crude broke above a key technical ceiling. Most other professionals doubted the longevity of the thrust, but given the situation and scenario, we had good reason to believe the move was the beginning of something big. Since then, crude oil prices have advanced from $51.66 per barrel to their current price of $61.45, against the odds.
It's tempting to take your gains off the table and wait for another re-entry point, or maybe even take on a short position and bet against what feels like an overheated move. And, a sizable pullback may well be what's in the cards. Just for the record though, we're already testing a major ceiling that -- if crossed -- could turn this bullish move into a full-blown meltup.
The weekly chart of crude oil below mostly speaks for itself. Two weeks ago we were wondering if crude futures would clear the 38.2% Fibonacci retracement line. They did, and sure enough, the buyers didn't look back. The psychological importance of clearing that hurdle can't be stated enough. There's an equally monumental resistance level in play now though -- the $62.00 level, where crude prices topped for a final time in 2015 before finally hitting bottom in early 2016. Not surprisingly, this is where the bulls have decided to take their break.
It would have been surprising if the rally didn't pause here. It's not necessarily a concern yet either. The oil rebound has been one of fits and starts, and that's apt to persist into the future. Better to pause and regroup now and fill up the tank for a longer ride if-and-when $62 is cleared than shoot above that mark now and end up waffling as profit-takers debate themselves.
Either way, if crude can regroup and then push above $62, there's not another meaningful ceiling until we reach the 61.8% Fibonacci retracement line around $79. A move that far sounds and seems crazy, but so did the move from $51 to $61.
You can't bet the farm yet. Indeed, to be clear, you can't really but anything as long as crude oil lingers in this proverbial purgatory. There's every chance something could go wildly wrong and not only put the uptrend on hold, but unwind it. A break back under the prior ceiling at $54.86 and/or the 100-day moving average line (blue) right around there right now could start something of a selling avalanche. Anything's possible. Not just anything is likely though. The underpinnings for oil prices -- which are supply, demand, and the value of the U.S. dollar -- all hint at a bullish rather than a bearish outcome here.
And yes, even the current prices defy the odds and the EIA's projected average price of $57.26 for 2018. Just bear in mind this is the same EIA that completely missed the 2014/2015 meltdown of oil, having never appreciated the risk of rising dollar and the world's overproduction of oil. It's just as likely to have missed the world's removal of oil-production capacity since 2015. The sharp decline in U.S. stockpiles of oil, however, speaks volumes.